Analytics: World
Analytics: World
Date: June 23, 2026
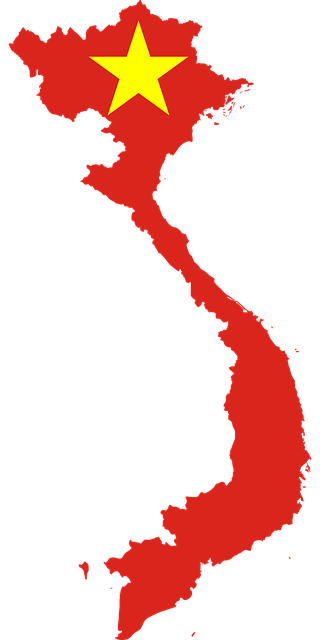
 Vietnam is a large country with 1.2% of the world's population. Vietnam is a communist, republic country. It has 8 world heritage sites. It produces 5.4% Rice of the world. It is rich in resources and has 14.2% Bismuth and 1.5% Tin of the world.
Vietnam is the 16th ranked country in population and 66th ranked in area out of 195 countries in the world. Please keep the country rank in perspective, for the highlights below.

 Total Military Force
 Rice prod.
 Facebook users
 Labour Force Participation
The Average Total Military Force of 195 countries in the world is 362,682. Vietnam is the 3rd highest ranked country out of 195 countries. This implies that the country is facing higher threats compared to other countries or may imply that the size or population of the country is higher.
Out of 195 countries in the world, Vietnam is the 5th highest ranked in Rice prod. . This is indicative of a more fertile land, suitable for producing high quantities of rice when compared to other countries.
Vietnam is the 7th highest ranked in Facebook users out of all the 195 countries.This may take into context a higher country population, or may simply imply that this country has more social media popularity, or may have a higher youth demographic.
The Average Labour Force Participation of 195 countries in the world is 14,659,929. Vietnam is the 10th highest ranked country out of 195 countries. This implies better employment opportunities,or imply that economic activity in this country is higher compared to other countries.
 GDP Per Capita (USD)
 Potatoes prod.
 Soyabean prod.
 Natural Gas Prod.
Vietnam is the 78th worst ranked in GDP Per Capita (USD) out of all the 195 countries.This implies that this country is a developing country.
Out of 195 countries in the world, Vietnam is the 115th worst ranked in Potatoes prod. . This is indicative of less focus on the production of potatoes, or scarcity of fertile land, or higher industrialisation as compared to other countries.
The Average Soyabean prod. of 195 countries in the world is 3,572,369. Vietnam is the 149th worst ranked country out of 195 countries. This is indicative of less focus on the production of soyabean, or scarcity of fertile land, or higher industrialisation as compared to other countries.
The Average Natural Gas Prod. of 195 countries in the world is 43,738. Vietnam is the 151st worst ranked country out of 195 countries. This indicates that natural resources are scarce in this country when compared to other countries, and it may be a huge importer of such resources.
| Sr. | Title | Metric | World Average | Rank out of 195 | Value | ||
|---|---|---|---|---|---|---|---|
|
Above World Average |
|||||||
| 1 | Vietnamese | # People | 8,500,000 | 1 | 1128 | ||
| 2 | Vietnamese as a % of total Vietnamese speakers | % People | 0 | 1 | 1125 | ||
| 3 | Khmer as a % of total Khmer speakers | % People | 0 | 2 | 1125 | ||
| 4 | Thai as a % of total Thai speakers | % People | 0 | 2 | 1129 | ||
| 5 | Mandarin Chinese as a % of total Mandarin Chinese speakers | % People | 0 | 6 | 1130 | ||
|
Below World Average |
|||||||
| 1 | Standard Chinese as a % of total Standard Chinese speakers | % People | 0 | 9 | 1233 | ||
| 2 | Standard Chinese | # People | 26,081,662 | 8 | 1232 | ||
| 3 | Khmer | # People | 4,397,500 | 2 | 1230 | ||
| 4 | Thai | # People | 13,314,666 | 2 | 1230 | ||
| Sr. | Title | Metric | World Average | Rank out of 195 | Value | ||
|---|---|---|---|---|---|---|---|
|
Above World Average |
|||||||
| 1 | Pop. with access to Electricity (%) | % People | 86 | 1 | 1127 | ||
| 2 | # Cities>5M | # Cities | 1 | 3 | 1129 | ||
| 3 | # Cities>5M | # Cities | 0 | 3 | 1128 | ||
| 4 | Rural Pop. | # People | 18,013,759 | 11 | 1130 | ||
| 5 | # Cities>1M | # Cities | 1 | 14 | 1125 | ||
| 6 | # Cities>1M | # Cities | 4 | 15 | 1125 | ||
| 7 | # Cities>300000 | # Cities | 7 | 15 | 1130 | ||
| 8 | # Cities>300000 | # Cities | 11 | 16 | 1129 | ||
| 9 | # Cities>100000 | # Cities | 21 | 19 | 1130 | ||
| 10 | # Cities>100000 | # Cities | 27 | 20 | 1126 | ||
| 11 | # Cities>500000 | # Cities | 4 | 20 | 1130 | ||
| 12 | # Cities>500000 | # Cities | 7 | 22 | 1125 | ||
| 13 | Urban Population (2021) | # People | 23,603,754 | 25 | 1127 | ||
| 14 | Rural Pop. /Total Pop. % | % People | 40 | 44 | 1126 | ||
|
Below World Average |
|||||||
| 1 | Urban Population / Total Population % . | % People | 60 | 152 | 1231 | ||
| Sr. | Title | Metric | World Average | Rank out of 195 | Value | ||
|---|---|---|---|---|---|---|---|
|
Above World Average |
|||||||
| 1 | FTAs in India via Kolkata (%) | % People | 2 | 1 | 1127 | ||
| 2 | INDs via Kolkata Airport (%) | % People | 2 | 4 | 1127 | ||
| 3 | INDs via Ahmedabad Airport (%) | % People | 1 | 5 | 1130 | ||
| 4 | INDs for Leisure (%) | % People | 46 | 5 | 1127 | ||
| 5 | Import Ban(Number of products) | Count | 12 | 7 | 1130 | ||
| 6 | Exports/Total GDP of the Country %. | 48 | 13 | 1126 | |||
| 7 | FTAs in India for Leisure (%) | % People | 42 | 13 | 1128 | ||
| 8 | Imports /Total GDP of the Country %. | 51 | 17 | 1128 | |||
| 9 | INDs from India | # People | 158,494 | 18 | 1130 | ||
| 10 | FDI (millions USD) | Amount | 3,288 | 20 | 1126 | ||
| 11 | FDI / Total FDI of the World %. | 0 | 20 | 1126 | |||
| 12 | Imports/Total Imports of the World %. | 0 | 20 | 1130 | |||
| 13 | Exports /Total Exports of the World %. | 0 | 22 | 1126 | |||
| 14 | Export of Goods and Services (in Million $) | Amount | 180,704 | 23 | 1127 | ||
| 15 | Import of Goods and Services (in Million $) | Amount | 173,515 | 24 | 1125 | ||
| 16 | FTAs in India | # People | 51,254 | 26 | 1127 | ||
| 17 | INDs via Cochin Airport (%) | % People | 3 | 35 | 1125 | ||
|
Below World Average |
|||||||
| 1 | INDs for Business (%) | % People | 25 | 190 | 1235 | ||
| 2 | INDs - Indian Diaspora (%) | % People | 22 | 184 | 1235 | ||
| 3 | FTAs in India - Indian Diaspora (%) | % People | 14 | 172 | 1231 | ||
| 4 | FTAs in India via Bengaluru (%) | % People | 6 | 151 | 1230 | ||
| 5 | FTAs in India via Mumbai (%) | % People | 23 | 163 | 1230 | ||
| 6 | Corporate Tax Rates in % | Rate | 23 | 130 | 1233 | ||
| 7 | FTAs in India via Cochin (%) | % People | 3 | 109 | 1233 | ||
| 8 | FTAs in India via Delhi (%) | % People | 46 | 143 | 1231 | ||
| 9 | INDs via Chennai Airport (%) | % People | 5 | 123 | 1232 | ||
| 10 | INDs via Hyderabad Airport (%) | % People | 3 | 110 | 1234 | ||
| 11 | FTAs in India via Chennai (%) | % People | 5 | 116 | 1233 | ||
| 12 | INDs via Delhi Airport (%) | % People | 38 | 128 | 1233 | ||
| 13 | INDs via Mumbai Airport (%) | % People | 33 | 116 | 1230 | ||
| 14 | INDs via Bengaluru Airport (%) | % People | 5 | 101 | 1232 | ||
| 15 | GDP Per Capita (USD) | $ | 18,044 | 118 | 1230 | ||
| 16 | GDP Per Capita at PPP (USD) | $ | 30,199 | 103 | 1230 | ||
| 17 | FTAs in India for Business (%) | % People | 18 | 90 | 1233 | ||
| 18 | FTAs in India for Education (%) | % People | 5 | 66 | 1230 | ||
| 19 | FTAs in India via Hyderabad (%) | % People | 3 | 44 | 1235 | ||
| 20 | GDP (Billions USD) | $ Billions | 600 | 33 | 1235 | ||
| 21 | GDP as a % of Total GDP | Percent | 0 | 33 | 1235 | ||
| Sr. | Title | Metric | World Average | Rank out of 195 | Value | ||
|---|---|---|---|---|---|---|---|
|
Above World Average |
|||||||
| 1 | Total Military Force | # People | 362,682 | 3 | 1129 | ||
| 2 | Military Force/Total World Military Force %. | % People | 0 | 3 | 1128 | ||
| 3 | Military Force/Total Pop. % | % People | 1 | 7 | 1129 | ||
|
Below World Average |
|||||||
| 1 | Lawyers Per 100K | People Per 100K | 137 | 42 | 1231 | ||
| 2 | Military Budget (in Billion $) | $ Billion | 17 | 38 | 1235 | ||
| 3 | Military Budget/Total World Military Budget %. | Percent | 0 | 37 | 1231 | ||
| Sr. | Title | Metric | World Average | Rank out of 195 | Value | ||
|---|---|---|---|---|---|---|---|
|
Above World Average |
|||||||
| 1 | Rice prod. | Tons | 6,920,442 | 5 | 1128 | ||
| 2 | Rice Produced/Total Rice Produced.% | Weight | 0 | 5 | 1128 | ||
| 3 | Orange Production (in tonnes) | Weight | 618,959 | 12 | 1127 | ||
| 4 | Orange Production (% of Total Orange Production) | Percent | 0 | 12 | 1130 | ||
| 5 | Sweet Potatoes prod. | Tons | 878,129 | 14 | 1126 | ||
| 6 | Sweet Potatoes Produced/Total Sweet Potatoes Produced % | Weight | 0 | 14 | 1129 | ||
| 7 | Honey prod. | Tons | 15,393 | 19 | 1128 | ||
| 8 | Honey Produced /Total Honey Produced % | Weight | 0 | 19 | 1128 | ||
| 9 | Chicken Meat Production (in tonnes) | Weight | 588,164 | 20 | 1128 | ||
| 10 | Chicken Meat Production (% of Total Chicken Meat Production) | Percent | 0 | 20 | 1128 | ||
| 11 | Tree density. | Density | 22,685 | 75 | 1126 | ||
|
Below World Average |
|||||||
| 1 | Flourite Produced/Total Flourite Produced % | Weight | 4 | 19 | 1235 | ||
| 2 | Tin Produced/Total Tin Produced in 2019 | Weight | 7 | 9 | 1233 | ||
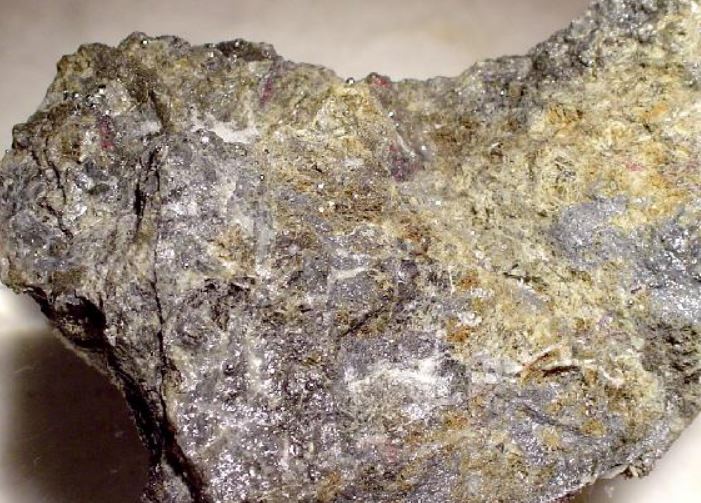
| 3 | Bismuth Produced/Total Bismuth Produced % | Weight | 14 | 2 | 1234 | ||
| 4 | Bauxite Produced/Total Bauxite Produced % | Weight | 7 | 11 | 1230 | ||
| 5 | Natural Gas Produced/Total Natural Gas Produced % | Mass | 5 | 45 | 1230 | ||
| 6 | Oil Prodcuced/Total Oil Produced % | 5 | 36 | 1230 | |||
| 7 | Tree density . | Density | 828 | 121 | 1231 | ||
| 8 | Potatoes Produced /Total Potatoes Produced % | Weight | 0 | 79 | 1235 | ||
| 9 | Potatoes prod. | Tons | 2,504,846 | 81 | 1234 | ||
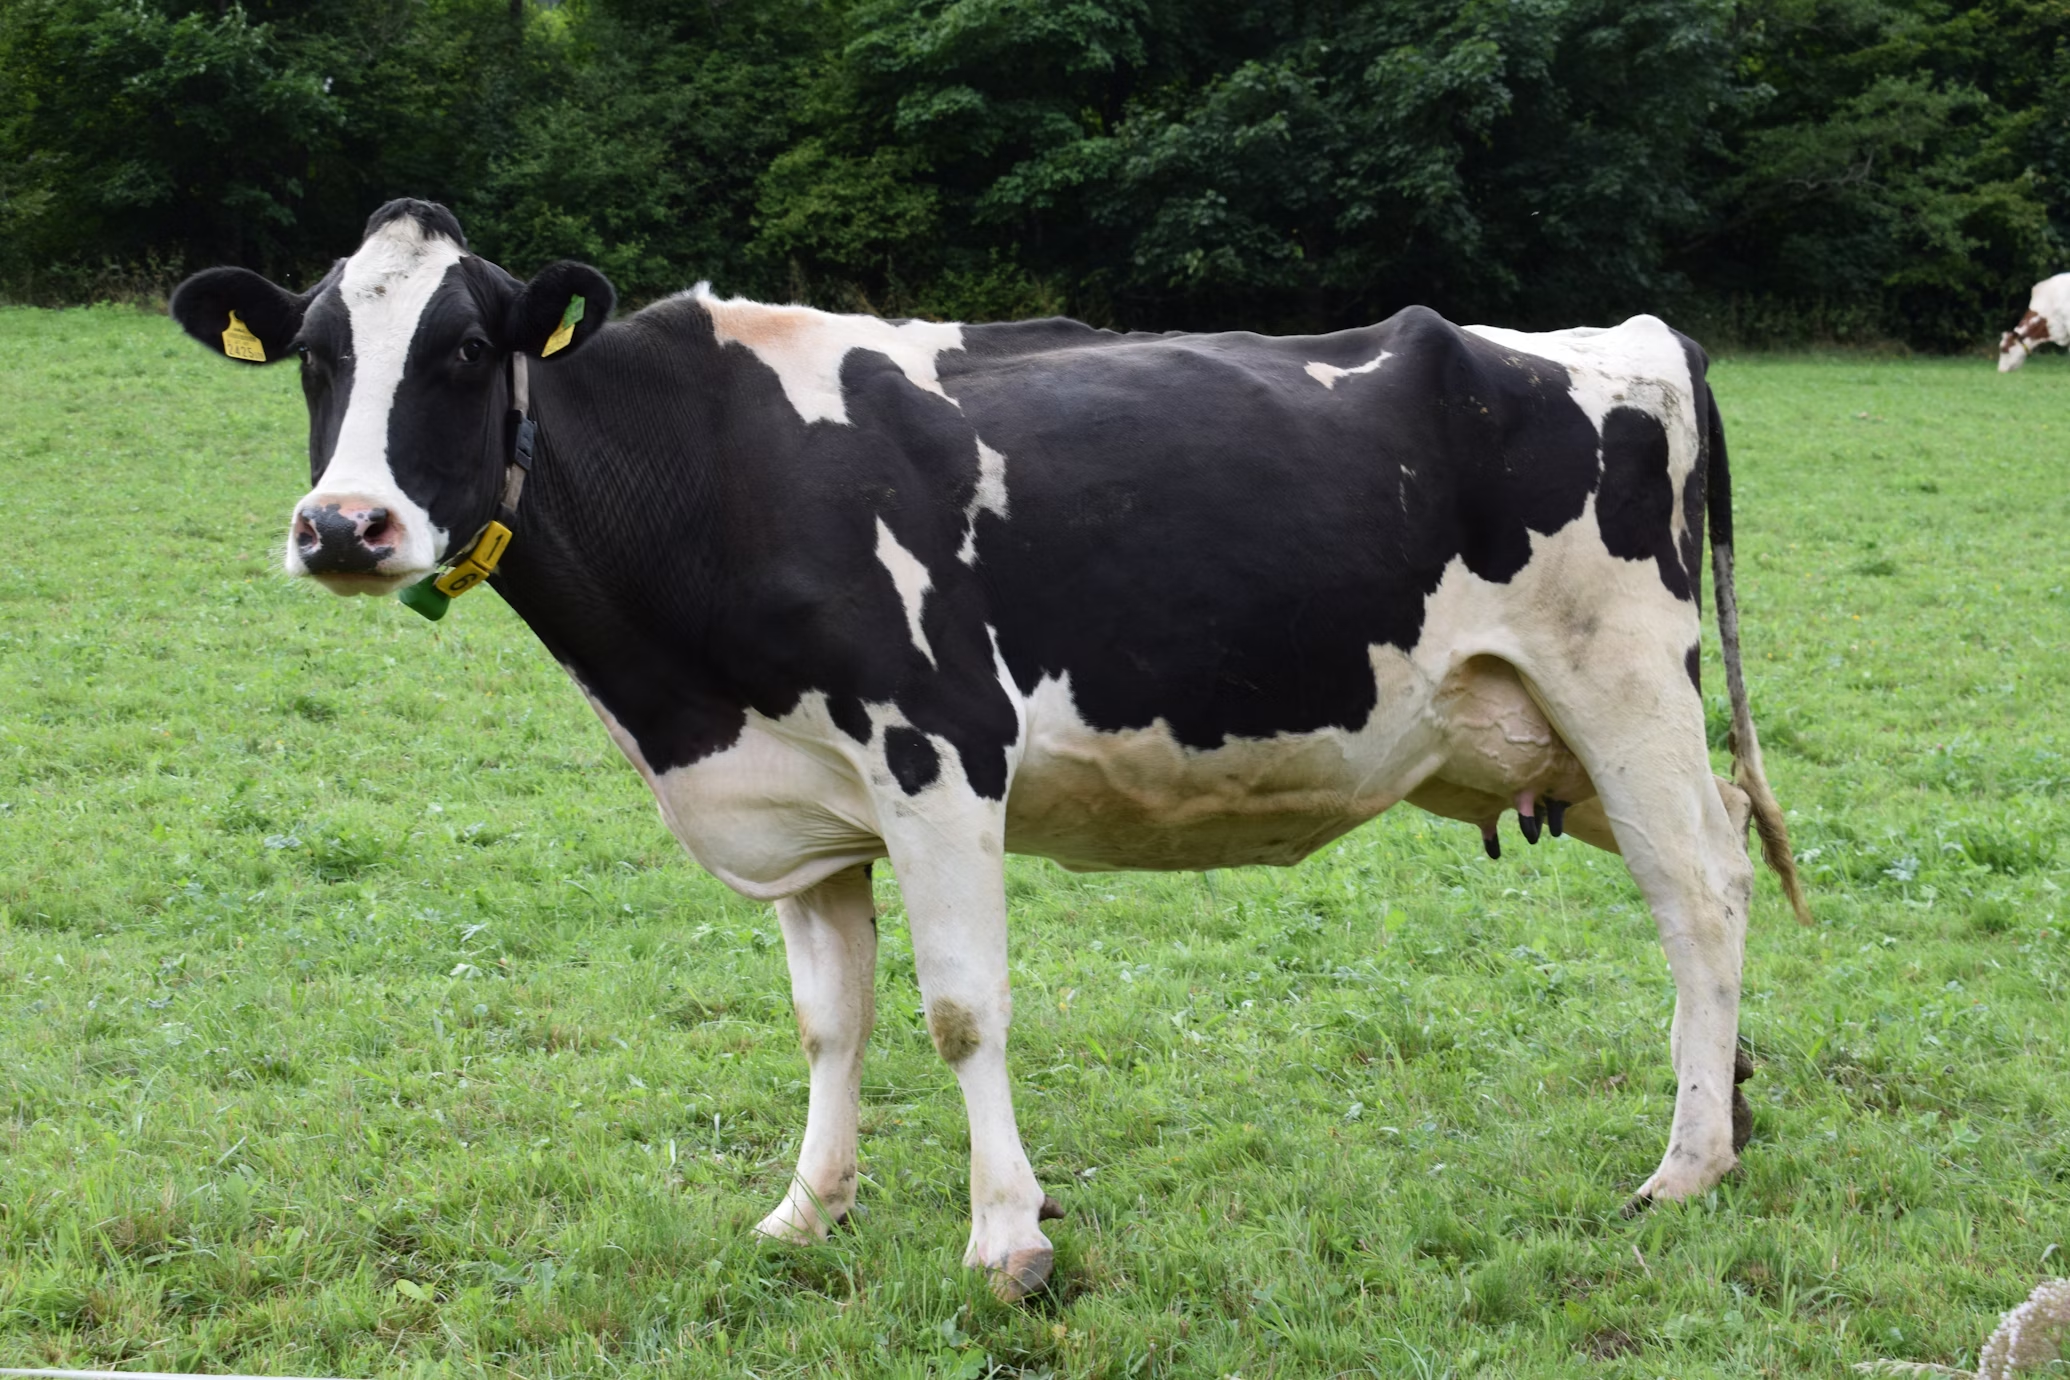
| 10 | Cow Milk Production (% of Total Cow Milk Production) | Percent | 0 | 66 | 1231 | ||
| 11 | Cow Milk Production (in tonnes) | Weight | 3,855,383 | 66 | 1233 | ||
| 12 | Cotton Production (in 1000 480 lb. Bales) | Weight | 1,707 | 64 | 1231 | ||
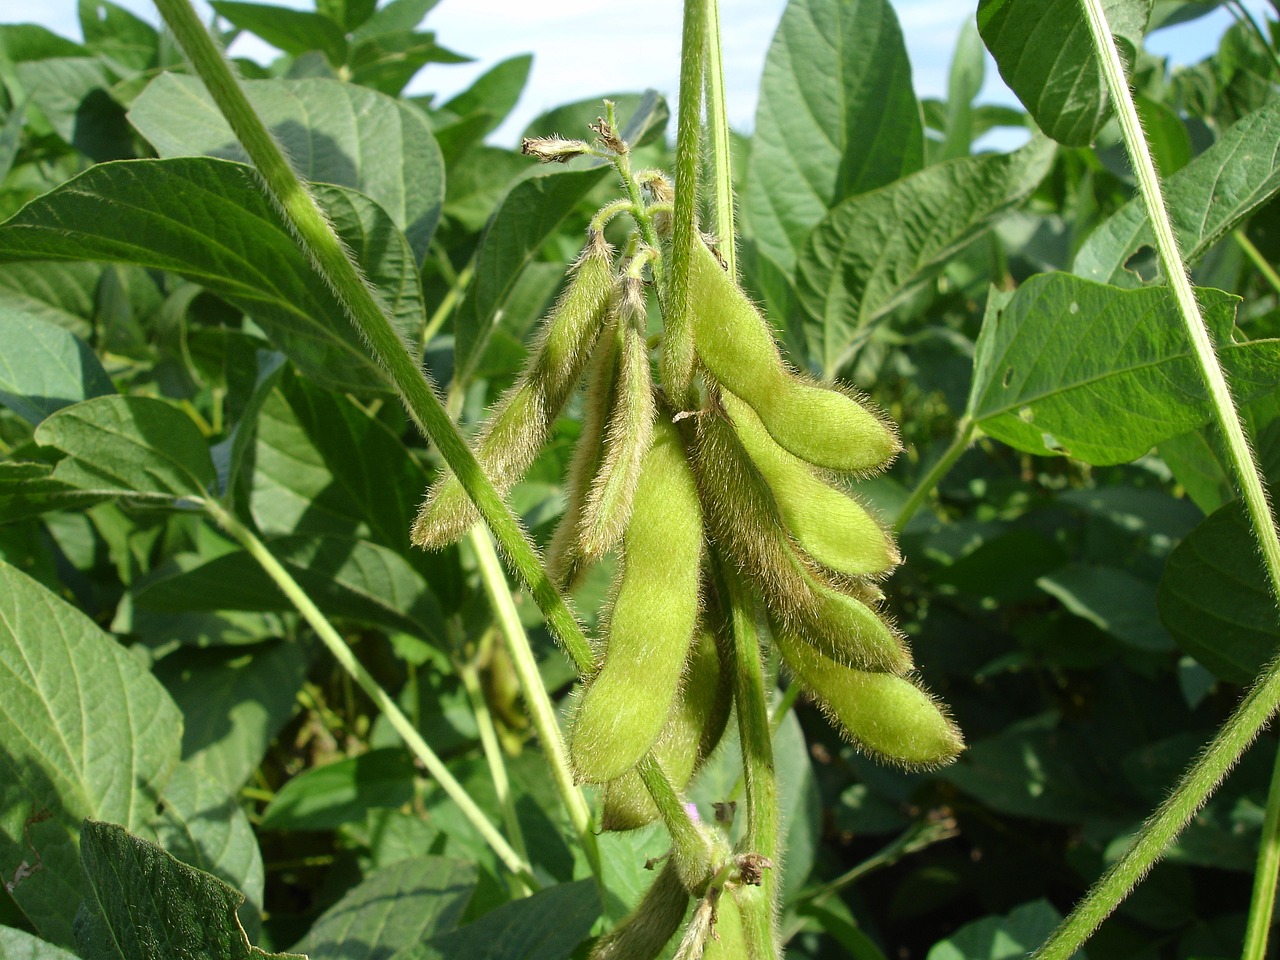
| 13 | Soyabean Produced/Total Soyabean Produced % | Weight | 1 | 47 | 1232 | ||
| 14 | Soyabean prod. | Tons | 3,572,369 | 47 | 1235 | ||
| 15 | Natural Gas Prod. | Million cubic meters | 43,738 | 45 | 1234 | ||
| 16 | Forest Area. | Area | 21,595,147 | 45 | 1232 | ||
| 17 | Country forest area / Global Forest area % | 0 | 45 | 1230 | |||
| 18 | Cows (% of Total Cows) | Percent | 0 | 41 | 1234 | ||
| 19 | Onion prod. | Tons | 819,042 | 41 | 1233 | ||
| 20 | Onion Produced/Total Onion Produced % | Weight | 0 | 41 | 1231 | ||
| 21 | Number of Cows | Count | 8,697,624 | 41 | 1231 | ||
| 22 | Cow Beef Production (in tonnes) | Weight | 320,761 | 38 | 1231 | ||
| 23 | Cow Beef Production (% of Total Cow Beef Production) | Percent | 0 | 38 | 1230 | ||
| 24 | Oil Prod. | Barrels/day | 855,887 | 37 | 1231 | ||
| 25 | Goat Meat Production (in tonnes) | Weight | 46,111 | 35 | 1233 | ||
| 26 | Goat Meat Production (% of Total Goat Meat Production) | Percent | 0 | 35 | 1235 | ||
| 27 | Iron Production (% of Total Iron Production) | Percent | 2 | 31 | 1231 | ||
| 28 | Iron Production (in 1000 metric tons) | Weight | 33,258 | 32 | 1233 | ||
| 29 | Flourite prod. | Tons | 231,501 | 20 | 1230 | ||
| 30 | Sugarcane prod. | Tons | 20,929,075 | 16 | 1232 | ||
| 31 | Sugarcane Produced/Total Sugarcane Produced.% | Weight | 2 | 16 | 1231 | ||
| 32 | Buffalo Milk Production (in tonnes) | Weight | 7,516,792 | 15 | 1234 | ||
| 33 | Buffalo Milk Production (% of Total Buffalo Milk Production) | Percent | 4 | 15 | 1235 | ||
| 34 | Coal Production (in 1000 metric tons) | Weight | 121,850 | 14 | 1234 | ||
| 35 | Coal Production (% of Total Coal Production) | Percent | 1 | 14 | 1233 | ||
| 36 | Bauxite prod. | Tons | 29,969 | 11 | 1235 | ||
| 37 | Tin prod. | Tons | 23,069 | 9 | 1235 | ||
| 38 | Number of Trees | Count | 15,642,617,148 | 6 | 1232 | ||
| Sr. | Title | Metric | World Average | Rank out of 195 | Value | ||
|---|---|---|---|---|---|---|---|
|
Above World Average |
|||||||
| 1 | FB Users / Total Int. Users %. | % People | 34 | 5 | 1125 | ||
| 2 | Instagram Users | Absolute | 10,458,072 | 5 | 1129 | ||
| 3 | Facebook users | # People | 11,706,915 | 7 | 1126 | ||
| 4 | FB Users / Total Pop. %. | % People | 27 | 7 | 1125 | ||
| 5 | Facebook Users as a % of Total facebook Users | % People | 0 | 7 | 1129 | ||
| 6 | Internet Users | # People | 28,543,790 | 13 | 1125 | ||
| 7 | X (Twitter) users | # People | 1,789,045 | 18 | 1128 | ||
| 8 | X (Twitter) Users as a % of Total X (Twitter) Users | % People | 0 | 18 | 1125 | ||
| 9 | LinkedIn users | # People | 7,145,162 | 24 | 1126 | ||
| 10 | LinkedIn Users as a % of Total LinkedIn Users | % People | 0 | 24 | 1129 | ||
| 11 | Instagram Users as a % of Total Instagram Users | % People | 0 | 32 | 1128 | ||
| 12 | Int. Users / Total Pop.% | % People | 69 | 97 | 1126 | ||
|
Below World Average |
|||||||
| 1 | Instagram Users as a % of Total Internet Users | % People | 36 | 140 | 1232 | ||
| 2 | LinkedIn Users as a % of Total Internet Users | % People | 37 | 132 | 1231 | ||
| 3 | Instagram Users as a % of Total Population | % People | 29 | 130 | 1230 | ||
| 4 | LinkedIn Users as a % of Total Population | % People | 34 | 120 | 1233 | ||
| 5 | Facebook CPC in Rs. | Absolute | 5 | 93 | 1232 | ||
| 6 | X (Twitter) Users as a % of Total Internet Users | % People | 12 | 88 | 1232 | ||
| 7 | X (Twitter) Users as a % of Total Population | % People | 13 | 86 | 1233 | ||
| Sr. | Title | Metric | World Average | Rank out of 195 | Value | ||
|---|---|---|---|---|---|---|---|
|
Above World Average |
|||||||
| 1 | Buddhist Pop./Total Buddhist Pop. % | % People | 0 | 8 | 1129 | ||
| 2 | Buddhist Pop./Total Pop.%. | % People | 3 | 12 | 1130 | ||
| 3 | World Heritage Sites | Count | 7 | 41 | 1128 | ||
|
Below World Average |
|||||||
| 1 | Islamic Pop./Total Pop.% | % People | 22 | 172 | 1230 | ||
| 2 | Christian Pop./Total Pop.% | % People | 42 | 126 | 1230 | ||
| 3 | Islamic Population | # People | 10,091,996 | 117 | 1232 | ||
| 4 | # Olympic Medals | Count | 146 | 73 | 1232 | ||
| 5 | Christian Population | # People | 16,917,912 | 55 | 1234 | ||
| 6 | Christian Pop./Total Christian Pop.% | % People | 0 | 54 | 1235 | ||
| 7 | Buddhist Population | # People | 21,931,470 | 8 | 1231 | ||
| Sr. | Title | Metric | World Average | Rank out of 195 | Value | ||
|---|---|---|---|---|---|---|---|
|
Above World Average |
|||||||
| 1 | Labour Force Participation | # People | 14,659,929 | 10 | 1130 | ||
| 2 | Employment in Agriculture | # People | 5,314,003 | 10 | 1128 | ||
| 3 | Total Labour Force (2021) | # People | 20,641,663 | 12 | 1125 | ||
| 4 | Total Labour Force/Total Pop. | % People | 43 | 14 | 1130 | ||
| 5 | Non-Agricultural Labour Force | # People | 15,067,127 | 14 | 1126 | ||
| 6 | Formal Jobs | # People | 10,605,934 | 15 | 1129 | ||
| 7 | Employment in Services | # People | 10,251,634 | 18 | 1126 | ||
| 8 | Employment in Agriculture /Total Pop. %. | % People | 9 | 28 | 1125 | ||
| 9 | Employment in Agri. / Total Labour Force % . | % People | 23 | 51 | 1126 | ||
| 10 | Employment in Agriculture/Total Labour force %. | % People | 23 | 51 | 1127 | ||
|
Below World Average |
|||||||
| 1 | Employment in Services / Total Labour Force %. | % People | 57 | 153 | 1233 | ||
| 2 | Employment in services/Total Labour force %. | % People | 56 | 153 | 1232 | ||
| 3 | Unemployment Rate. | % People | 6 | 130 | 1233 | ||
| 4 | Non-Agri Labour force/Total Labour force %. | % People | 76 | 127 | 1234 | ||
| 5 | Wage & Salaried Workers / Total Labour Force % | % People | 59 | 120 | 1232 | ||
| 6 | Employment in Services /Total pop.%. | % People | 25 | 114 | 1232 | ||
| 7 | Unemployed Labour Force. | # People | 1,511,199 | 31 | 1232 | ||
| Sr. | Title | Metric | World Average | Rank out of 195 | Value | ||
|---|---|---|---|---|---|---|---|
|
Above World Average |
|||||||
| 1 | # Mobile phone numbers | Count | 40,393,496 | 12 | 1127 | ||
| 2 | # Phone Numbers /Total Pop. % | Percent | 101 | 42 | 1125 | ||
| Sr. | Title | Metric | World Average | Rank out of 195 | Value | ||
|---|---|---|---|---|---|---|---|
|
Above World Average |
|||||||
| 1 | Enrolment in secondary edu. | # People | 3,225,437 | 13 | 1129 | ||
| 2 | Total Literate Pop. | # People | 34,678,001 | 13 | 1127 | ||
| 3 | Enrolment in primary edu. | # People | 3,831,465 | 17 | 1125 | ||
| 4 | Teachers in secondary edu. | # People | 201,153 | 18 | 1126 | ||
| 5 | Teachers in primary edu. | # People | 112,672 | 21 | 1126 | ||
| 6 | Enrolment in tertiary edu.(all programmes) | # People | 1,420,982 | 22 | 1128 | ||
| 7 | Teachers in tertiary edu. | # People | 80,879 | 23 | 1125 | ||
| 8 | Literacy Rate (%) | % People | 86 | 95 | 1129 | ||
|
Below World Average |
|||||||
| 1 | Teachers as a % of Enrolment | % People | 41 | 96 | 1233 | ||
| 2 | Enrolment in Tertiary Edu/Total Literate Pop. %. | % People | 9 | 107 | 1233 | ||
| 3 | Enrolment in Tertiary Edu./ Total Pop. %. | % People | 9 | 102 | 1234 | ||
| 4 | Enrolment in Primary Edu./ Total Literate Pop %. | % People | 36 | 110 | 1233 | ||
| 5 | Enrolment in Primary Edu./Total Pop %. | % People | 27 | 108 | 1233 | ||
| 6 | # Students per teacher in Primary edu. | Ratio | 260 | 68 | 1235 | ||
| 7 | # Total Teachers (Primary+Secondary+Tertiary) | # People | 2,895,876 | 16 | 1230 | ||
| 8 | # Students per teacher in secondary edu. | Ratio | 57 | 48 | 1235 | ||
| 9 | Enrolment in Secondary Edu./Total Literate Pop. | % People | 28 | 53 | 1233 | ||
| 10 | # Total Students (Primary+Secondary+Tertiary) | # People | 38,831,325 | 16 | 1233 | ||
| 11 | Enrolment in Secondary Edu./Total Pop %. | % People | 23 | 34 | 1230 | ||
| Sr. | Title | Metric | World Average | Rank out of 195 | Value | ||
|---|---|---|---|---|---|---|---|
|
Above World Average |
|||||||
| 1 | Total Population | # People | 42,357,833 | 16 | 1129 | ||
| 2 | Male Population | # People | 21,291,067 | 16 | 1130 | ||
| 3 | Female Population | # People | 21,066,765 | 16 | 1128 | ||
| 4 | Total Births | # People | 677,551 | 21 | 1130 | ||
| 5 | Female % of Total Pop. | % People | 50 | 50 | 1129 | ||
| 6 | Total Deaths | # People | 321,991 | 16 | 1129 | ||
|
Below World Average |
|||||||
| 1 | Male % of Total Pop. | % People | 50 | 146 | 1233 | ||
| 2 | Population Growth Rate (%) | % People | 0 | 117 | 1235 | ||
| Sr. | Title | Metric | World Average | Rank out of 195 | Value | ||
|---|---|---|---|---|---|---|---|
|
Above World Average |
|||||||
| 1 | Total No. of Pharmacists | # People | 19,528 | 18 | 1126 | ||
| 2 | Total No. of Doctors | # People | 78,648 | 31 | 1130 | ||
| 3 | Life Expectancy at Birth, both sexes | Age | 73 | 82 | 1130 | ||
| 4 | No. of people HIV infected/Total pop. | # People | 5,202 | 33 | 1127 | ||
Mother Tongue : Vietnamese
Literacy Rate (%) : 95.80
| Country Capital | : | Hanoi |
|---|---|---|
| GDP Per Capita | : | 4,806 |
| GDP Per Capita Rank | : | 120th/195 |
| Life Expectancy | : | 75 |
| Unemployment Rate | : | 1 |
| Number of Internet Users | : | 79,780,138 |
| Internet Users Rank | : | 13th/195 |
| Area | : | 313,409 |
| Area Rank | : | 66th/195 |
| Total Population | : | 102,177,431 |
| Total Population Rank | : | 16th/195 |
| Sr. | City | Total City Population (2023) |
|---|---|---|
| 1 | Bà R?a | 206,932 |
| 2 | Bac Giang | 203,304 |
| 3 | B?c Liêu | 242,080 |
| 4 | B?c Ninh | 225,512 |
| 5 | B?o L?c | 172,369 |
| 6 | B?n Tre | 125,504 |
| 7 | Biên Hòa | 1,261,404 |
| 8 | Buôn Ma Thu?t | 506,427 |
| 9 | Cà Mau | 317,943 |
| 10 | C?m Ph? | 205,160 |
| 11 | Cam Ranh | 122,076 |
| 12 | C?n Th? | 1,261,396 |
| 13 | Cao Lãnh | 213,708 |
| 14 | Châu ??c | 162,917 |
| 15 | Chí Linh | 222,290 |
| 16 | ?à N?ng | 1,386,215 |
| 17 | ?à L?t | 235,044 |
| 18 | ??ng H?i | 170,433 |
| 19 | ??ng Xoài | 151,324 |
| 20 | H?i Phòng | 2,378,737 |
| 21 | H? Long | 302,813 |
| 22 | H?i D??ng | 511,771 |
| 23 | Hà N?i | 8,401,425 |
| 24 | H? Chí Minh | 9,069,321 |
| 25 | Hu? | 658,104 |
| 26 | H?ng Yên | 148,524 |
| 27 | Kon Tum | 174,176 |
| 28 | Long Khánh | 247,117 |
| 29 | Long Xuyên | 385,380 |
| 30 | M? Tho | 272,995 |
| 31 | Nam ??nh | 415,846 |
| 32 | Nha Trang | 539,535 |
| 33 | Ninh Bình | 161,524 |
| 34 | Phan Rang–Tháp Chàm | 168,286 |
| 35 | Phan Thi?t | 338,054 |
| 36 | Ph? Lý | 137,812 |
| 37 | Pleiku | 462,631 |
| 38 | Qu?ng Ngãi | 305,004 |
| 39 | Quy Nh?n | 461,278 |
| 40 | R?ch Giá | 406,537 |
| 41 | Sa ?éc | 216,429 |
| 42 | S?m S?n | 173,811 |
| 43 | Sóc Tr?ng | 223,307 |
| 44 | S?n La | 106,951 |
| 45 | Sông Công | 110,337 |
| 46 | Tam ?i?p | 105,058 |
| 47 | Tam K? | 166,641 |
| 48 | Tân An | 217,075 |
| 49 | Tây Ninh | 154,839 |
| 50 | Thái Bình | 270,440 |
| 51 | Thái Nguyên | 423,561 |
| 52 | Thanh Hóa | 619,709 |
| 53 | Th? D?u M?t | 420,535 |
| 54 | Trà Vinh | 161,669 |
| 55 | Tuy Hòa | 203,743 |
| 56 | Tuyên Quang | 105,532 |
| 57 | Uông Bí | 176,159 |
| 58 | Vi?t Trì | 418,801 |
| 59 | Vinh | 506,397 |
| 60 | V?nh Long | 201,817 |
| 61 | V?nh Yên | 154,096 |
| 62 | V?ng Tàu | 360,152 |
Q - Does Prarang do surveys to collect data? How does Prarang have such granular
Country-level details which no private or public data source offers?
A - Prarang does not conduct surveys to gather data; instead, we rely on publicly available
sources such as UN Population data, the CIA World Factbook, and private surveys whose results
are accessible through news media and public websites. Our data classification follows a
three-fold method rooted in Indian logic (Tarkashastra): Pramana (evidence-based data
collection) involves gathering data from credible sources; Anumana (estimation and inference)
uses modeling to draw inferences from the collected data; and Upamana (comparison) ranks
countries through relative comparison, calculating the Samana (country average) to determine
whether each country ranks above or below this benchmark. All data sources and estimation
modeling methods are transparently detailed and accessible, with information available for each
data field by clicking the "i" icon.
A - Prarang does not do any surveys. It does data modeling & estimations based on third-party census & surveys, already in the public domain. It also shares the source of the data it uses. Users need to make their own judgment of how and for what purpose and when they use the data that they download from this Prarang website.