Analytics: World
Analytics: World
Date: June 14, 2026
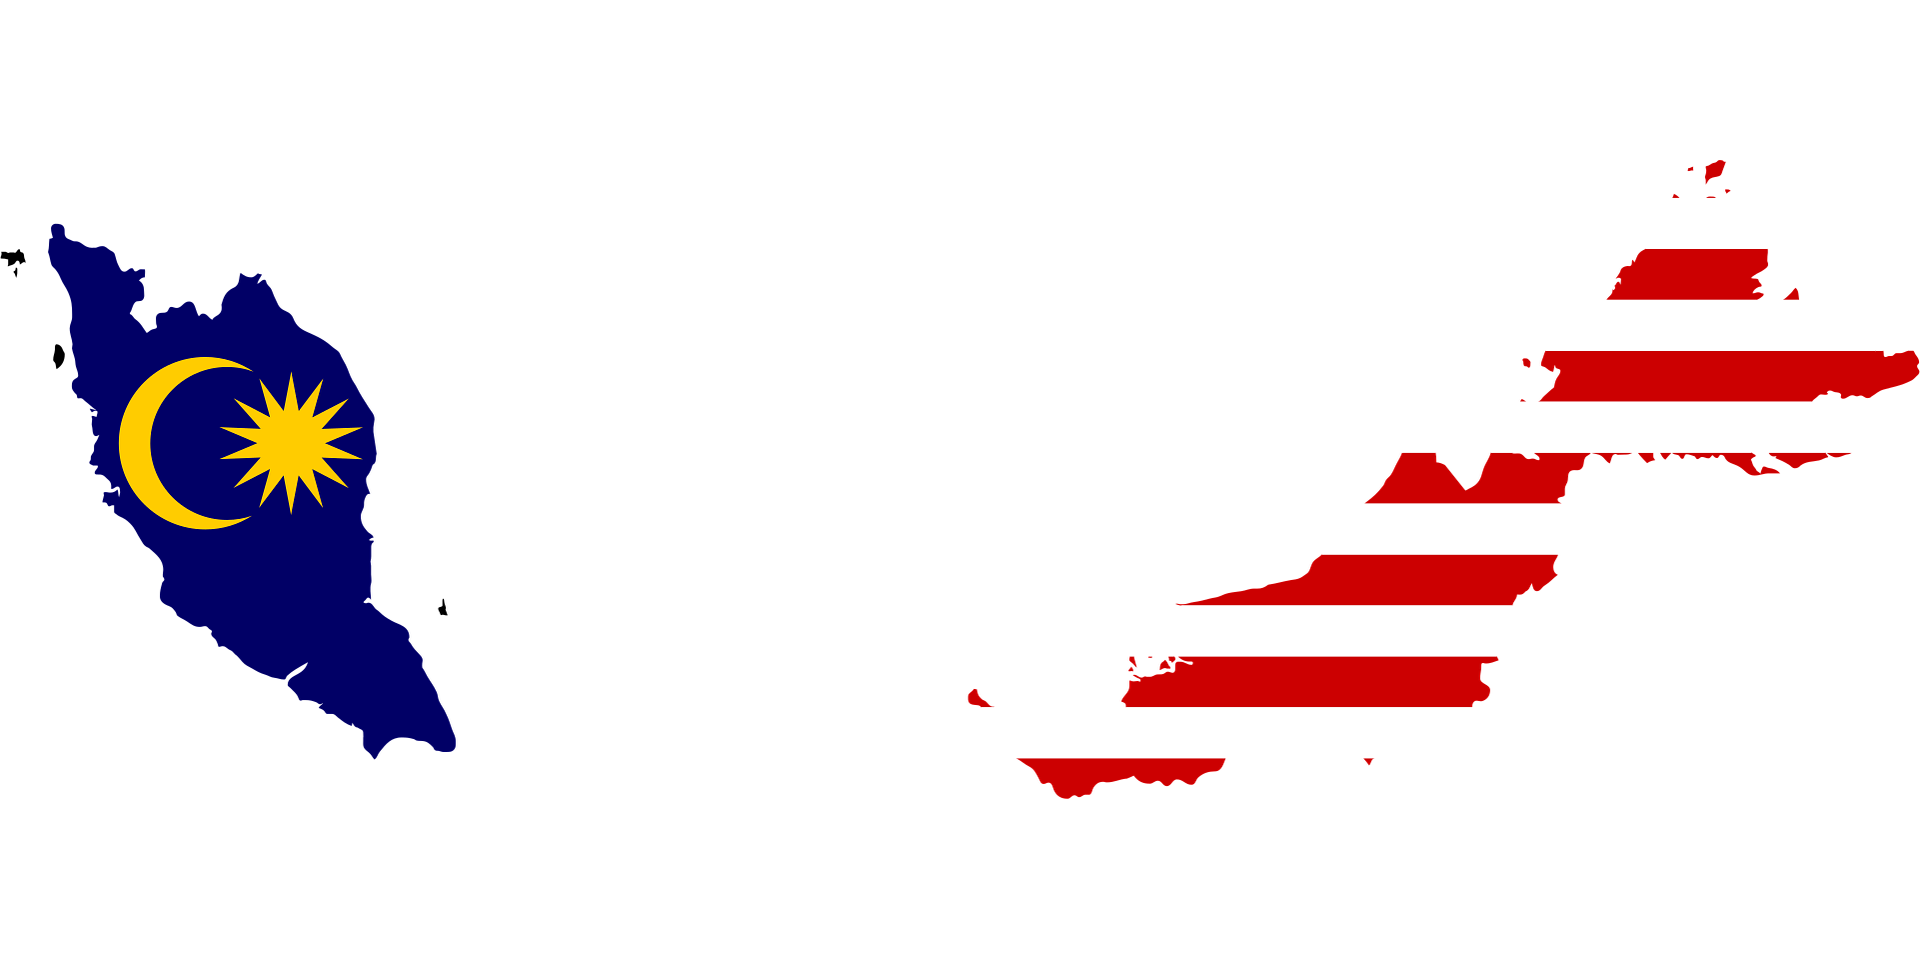
 Malaysia is a mid-size country with 0.0002% of the world's population. Malaysia is a republic country. It has 5 world heritage sites. It is rich in resources and has 1.8% Natural Gas and 1.3% Tin of the world.
Malaysia is the 45th ranked country in population and 180th ranked in area out of 195 countries in the world. Please keep the country rank in perspective, for the highlights below.
 Natural Gas Prod.
 Facebook users
 Total Military Force
 Internet Users
Malaysia is the 12th highest ranked in Natural Gas Prod. out of all the 195 countries.This is indicative of a rich reserve of natural resources in comparison to other countries, and may be a huge exporter of such resources.
Out of 195 countries in the world, Malaysia is the 23rd highest ranked in Facebook users . This may take into context a higher country population, or may simply imply that this country has more social media popularity, or may have a higher youth demographic.
Out of 195 countries in the world, Malaysia is the 24th highest ranked in Total Military Force . This implies that the country is facing higher threats compared to other countries or may imply that the size or population of the country is higher.
Out of 195 countries in the world, Malaysia is the 29th highest ranked in Internet Users . This may take into context a higher country population, and implies that there are significantly more people with access to the internet when compared to other countries.
 Sugarcane prod.
 GDP Per Capita (USD)
 Teachers in primary edu.
The Average Sugarcane prod. of 195 countries in the world is 20,929,075. Malaysia is the 114th worst ranked country out of 195 countries. This is indicative of less focus on the production of sugarcane, or scarcity of fertile land, or higher industrialisation as compared to other countries.
Out of 195 countries in the world, Malaysia is the 124th worst ranked in GDP Per Capita (USD) . This implies that this country is a developing country.
Out of 195 countries in the world, Malaysia is the 127th worst ranked in Rural Pop. . This may indicate that there is a high degree of industrialisation, or better urbanisation and development policies in place in comparison to other countries.
The Average Teachers in primary edu. of 195 countries in the world is 112,672. Malaysia is the 134th worst ranked country out of 195 countries. This may indicate that the investment by the country in primary education is lesser when compared to other countries.
| Sr. | Title | Metric | World Average | Rank out of 195 | Value | ||
|---|---|---|---|---|---|---|---|
|
Above World Average |
|||||||
| 1 | Pop. with access to Electricity (%) | % People | 86 | 1 | 1126 | ||
| 2 | # Cities>500000 | # Cities | 4 | 12 | 1130 | ||
| 3 | # Cities>500000 | # Cities | 7 | 13 | 1127 | ||
| 4 | # Cities>300000 | # Cities | 7 | 13 | 1125 | ||
| 5 | # Cities>300000 | # Cities | 11 | 15 | 1127 | ||
| 6 | # Cities>100000 | # Cities | 21 | 15 | 1129 | ||
| 7 | # Cities>100000 | # Cities | 27 | 16 | 1125 | ||
| 8 | Urban Population (2021) | # People | 23,603,754 | 33 | 1126 | ||
| 9 | Urban Population / Total Population % . | % People | 60 | 51 | 1129 | ||
|
Below World Average |
|||||||
| 1 | Rural Pop. /Total Pop. % | % People | 40 | 145 | 1231 | ||
| 2 | # Cities>1M | # Cities | 1 | 39 | 1231 | ||
| 3 | Rural Pop. | # People | 18,013,759 | 69 | 1231 | ||
| 4 | # Cities>1M | # Cities | 4 | 27 | 1234 | ||
| Sr. | Title | Metric | World Average | Rank out of 195 | Value | ||
|---|---|---|---|---|---|---|---|
|
Above World Average |
|||||||
| 1 | Malay | # People | 2,434,606 | 2 | 1128 | ||
| 2 | Malay as a % of total Malay speakers | % People | 0 | 2 | 1127 | ||
| 3 | Standard Chinese as a % of total Standard Chinese speakers | % People | 0 | 2 | 1125 | ||
| 4 | Tamil as a % of total Tamil speakers | % People | 0 | 3 | 1129 | ||
| 5 | Mandarin Chinese as a % of total Mandarin Chinese speakers | % People | 0 | 4 | 1128 | ||
|
Below World Average |
|||||||
| 1 | English | # People | 10,677,446 | 22 | 1231 | ||
| 2 | English as a % of total English speakers | % People | 0 | 21 | 1230 | ||
| 3 | Gujarati | # People | 3,567,082 | 8 | 1235 | ||
| 4 | Burmese | # People | 3,898,788 | 6 | 1232 | ||
| 5 | Burmese as a % of total Burmese speakers | % People | 0 | 6 | 1234 | ||
| 6 | Gujarati as a % of total Gujarati speakers | % People | 0 | 6 | 1233 | ||
| 7 | Telugu | # People | 7,474,845 | 4 | 1235 | ||
| 8 | Malayalam as a % of total Malayalam speakers | % People | 0 | 4 | 1232 | ||
| 9 | Telugu as a % of total Telugu speakers | % People | 0 | 4 | 1233 | ||
| 10 | Standard Chinese | # People | 26,081,662 | 3 | 1233 | ||
| 11 | Tamil | # People | 14,930,166 | 3 | 1234 | ||
| Sr. | Title | Metric | World Average | Rank out of 195 | Value | ||
|---|---|---|---|---|---|---|---|
|
Above World Average |
|||||||
| 1 | FTAs in India via Chennai (%) | % People | 5 | 4 | 1130 | ||
| 2 | INDs via Chennai Airport (%) | % People | 5 | 4 | 1125 | ||
| 3 | FTAs in India | # People | 51,254 | 6 | 1130 | ||
| 4 | Import Ban(Number of products) | Count | 12 | 10 | 1130 | ||
| 5 | INDs for Leisure (%) | % People | 46 | 10 | 1126 | ||
| 6 | INDs from India | # People | 158,494 | 11 | 1129 | ||
| 7 | INDs via Cochin Airport (%) | % People | 3 | 14 | 1125 | ||
| 8 | INDs via Hyderabad Airport (%) | % People | 3 | 15 | 1125 | ||
| 9 | INDs via Trivandrum Airport (%) | % People | 1 | 16 | 1127 | ||
| 10 | FTAs in India via Cochin (%) | % People | 3 | 17 | 1130 | ||
| 11 | INDs via Kolkata Airport (%) | % People | 2 | 17 | 1129 | ||
| 12 | FDI / Total FDI of the World %. | 0 | 24 | 1126 | |||
| 13 | Exports/Total GDP of the Country %. | 48 | 27 | 1127 | |||
| 14 | Exports /Total Exports of the World %. | 0 | 29 | 1129 | |||
| 15 | Import of Goods and Services (in Million $) | Amount | 173,515 | 30 | 1130 | ||
| 16 | Imports/Total Imports of the World %. | 0 | 30 | 1129 | |||
| 17 | Export of Goods and Services (in Million $) | Amount | 180,704 | 31 | 1129 | ||
| 18 | FDI (millions USD) | Amount | 3,288 | 33 | 1127 | ||
| 19 | INDs via Ahmedabad Airport (%) | % People | 1 | 33 | 1129 | ||
| 20 | FTAs in India for Leisure (%) | % People | 42 | 37 | 1126 | ||
| 21 | INDs via Bengaluru Airport (%) | % People | 5 | 38 | 1126 | ||
| 22 | Imports /Total GDP of the Country %. | 51 | 42 | 1130 | |||
| 23 | FTAs in India - Indian Diaspora (%) | % People | 14 | 48 | 1129 | ||
| 24 | GDP Per Capita at PPP (USD) | $ | 30,199 | 51 | 1126 | ||
| 25 | Corporate Tax Rates in % | Rate | 23 | 114 | 1130 | ||
|
Below World Average |
|||||||
| 1 | INDs via Delhi Airport (%) | % People | 38 | 182 | 1232 | ||
| 2 | INDs via Mumbai Airport (%) | % People | 33 | 184 | 1235 | ||
| 3 | FTAs in India via Delhi (%) | % People | 46 | 182 | 1233 | ||
| 4 | FTAs in India via Mumbai (%) | % People | 23 | 166 | 1234 | ||
| 5 | INDs for Business (%) | % People | 25 | 161 | 1234 | ||
| 6 | FTAs in India for Business (%) | % People | 18 | 157 | 1235 | ||
| 7 | INDs - Indian Diaspora (%) | % People | 22 | 154 | 1235 | ||
| 8 | FTAs in India via Bengaluru (%) | % People | 6 | 121 | 1233 | ||
| 9 | FTAs in India via Hyderabad (%) | % People | 3 | 75 | 1230 | ||
| 10 | INDs for Education (%) | % People | 3 | 70 | 1233 | ||
| 11 | FTAs in India via Kolkata (%) | % People | 2 | 43 | 1234 | ||
| 12 | GDP Per Capita (USD) | $ | 18,044 | 72 | 1233 | ||
| 13 | INDs via Calicut Airport (%) | % People | 1 | 31 | 1235 | ||
| 14 | GDP (Billions USD) | $ Billions | 600 | 36 | 1235 | ||
| 15 | GDP as a % of Total GDP | Percent | 0 | 34 | 1230 | ||
| Sr. | Title | Metric | World Average | Rank out of 195 | Value | ||
|---|---|---|---|---|---|---|---|
|
Above World Average |
|||||||
| 1 | Buddhist Pop./Total Buddhist Pop. % | % People | 0 | 10 | 1130 | ||
| 2 | Buddhist Pop./Total Pop.%. | % People | 3 | 11 | 1128 | ||
| 3 | Hindu Pop./Total Pop.%. | % People | 2 | 14 | 1130 | ||
| 4 | Islamic Population | # People | 10,091,996 | 20 | 1126 | ||
| 5 | Islamic Pop./Total Islamic Pop.% | % People | 0 | 20 | 1129 | ||
| 6 | Islamic Pop./Total Pop.% | % People | 22 | 42 | 1125 | ||
|
Below World Average |
|||||||
| 1 | Christian Pop./Total Pop.% | % People | 42 | 124 | 1230 | ||
| 2 | Christian Pop./Total Christian Pop.% | % People | 0 | 81 | 1235 | ||
| 3 | Christian Population | # People | 16,917,912 | 82 | 1230 | ||
| 4 | World Heritage Sites | Count | 7 | 66 | 1233 | ||
| 5 | # Olympic Medals | Count | 146 | 68 | 1234 | ||
| 6 | Total Medals | Count | 12 | 58 | 1232 | ||
| 7 | Bronze Medal | Count | 5 | 37 | 1235 | ||
| 8 | Buddhist Population | # People | 21,931,470 | 10 | 1235 | ||
| 9 | Hindu Population | # People | 52,631,217 | 7 | 1233 | ||
| 10 | Hindu Pop./Total Hindu Pop.% | % People | 0 | 7 | 1235 | ||
| Sr. | Title | Metric | World Average | Rank out of 195 | Value | ||
|---|---|---|---|---|---|---|---|
|
Above World Average |
|||||||
| 1 | Natural Gas Prod. | Million cubic meters | 43,738 | 12 | 1128 | ||
| 2 | Chicken Meat Production (in tonnes) | Weight | 588,164 | 19 | 1127 | ||
| 3 | Chicken Meat Production (% of Total Chicken Meat Production) | Percent | 0 | 19 | 1126 | ||
| 4 | Tree density. | Density | 22,685 | 20 | 1130 | ||
|
Below World Average |
|||||||
| 1 | Tin Produced/Total Tin Produced in 2019 | Weight | 7 | 10 | 1230 | ||
| 2 | Number of Trees | Count | 15,642,617,148 | 152 | 1233 | ||
| 3 | Cow Milk Production (% of Total Cow Milk Production) | Percent | 0 | 126 | 1233 | ||
| 4 | Cow Milk Production (in tonnes) | Weight | 3,855,383 | 137 | 1235 | ||
| 5 | Oil Prodcuced/Total Oil Produced % | 5 | 29 | 1230 | |||
| 6 | Natural Gas Produced/Total Natural Gas Produced % | Mass | 5 | 12 | 1235 | ||
| 7 | Cows (% of Total Cows) | Percent | 0 | 108 | 1233 | ||
| 8 | Number of Cows | Count | 8,697,624 | 112 | 1233 | ||
| 9 | Cow Beef Production (% of Total Cow Beef Production) | Percent | 0 | 103 | 1233 | ||
| 10 | Cow Beef Production (in tonnes) | Weight | 320,761 | 103 | 1235 | ||
| 11 | Orange Production (% of Total Orange Production) | Percent | 0 | 76 | 1232 | ||
| 12 | Goat Meat Production (% of Total Goat Meat Production) | Percent | 0 | 81 | 1235 | ||
| 13 | Goat Meat Production (in tonnes) | Weight | 46,111 | 86 | 1231 | ||
| 14 | Sugarcane prod. | Tons | 20,929,075 | 82 | 1230 | ||
| 15 | Orange Production (in tonnes) | Weight | 618,959 | 80 | 1230 | ||
| 16 | Tree density . | Density | 828 | 59 | 1233 | ||
| 17 | Sweet Potatoes prod. | Tons | 878,129 | 55 | 1231 | ||
| 18 | Sweet Potatoes Produced/Total Sweet Potatoes Produced % | Weight | 0 | 54 | 1235 | ||
| 19 | Coal Production (in 1000 metric tons) | Weight | 121,850 | 35 | 1233 | ||
| 20 | Coal Production (% of Total Coal Production) | Percent | 1 | 35 | 1233 | ||
| 21 | Forest Area. | Area | 21,595,147 | 32 | 1232 | ||
| 22 | Country forest area / Global Forest area % | 0 | 32 | 1235 | |||
| 23 | Oil Prod. | Barrels/day | 855,887 | 29 | 1234 | ||
| 24 | Rice prod. | Tons | 6,920,442 | 27 | 1235 | ||
| 25 | Rice Produced/Total Rice Produced.% | Weight | 0 | 27 | 1235 | ||
| 26 | Iron Production (in 1000 metric tons) | Weight | 33,258 | 20 | 1234 | ||
| 27 | Iron Production (% of Total Iron Production) | Percent | 2 | 20 | 1232 | ||
| 28 | Buffalo Milk Production (in tonnes) | Weight | 7,516,792 | 18 | 1231 | ||
| 29 | Tin prod. | Tons | 23,069 | 10 | 1235 | ||
| Sr. | Title | Metric | World Average | Rank out of 195 | Value | ||
|---|---|---|---|---|---|---|---|
|
Above World Average |
|||||||
| 1 | Male % of Total Pop. | % People | 50 | 13 | 1127 | ||
| 2 | Population Growth Rate (%) | % People | 0 | 83 | 1125 | ||
|
Below World Average |
|||||||
| 1 | Female % of Total Pop. | % People | 50 | 183 | 1234 | ||
| 2 | Total Births | # People | 677,551 | 59 | 1231 | ||
| 3 | Female Population | # People | 21,066,765 | 47 | 1234 | ||
| 4 | Total Population | # People | 42,357,833 | 45 | 1232 | ||
| 5 | Male Population | # People | 21,291,067 | 43 | 1233 | ||
| Sr. | Title | Metric | World Average | Rank out of 195 | Value | ||
|---|---|---|---|---|---|---|---|
|
Above World Average |
|||||||
| 1 | Int. Users / Total Pop.% | % People | 69 | 13 | 1129 | ||
| 2 | FB Users / Total Pop. %. | % People | 27 | 19 | 1129 | ||
| 3 | X (Twitter) users | # People | 1,789,045 | 21 | 1127 | ||
| 4 | X (Twitter) Users as a % of Total X (Twitter) Users | % People | 0 | 21 | 1129 | ||
| 5 | Instagram Users as a % of Total Instagram Users | % People | 0 | 22 | 1126 | ||
| 6 | Facebook users | # People | 11,706,915 | 23 | 1128 | ||
| 7 | Facebook Users as a % of Total facebook Users | % People | 0 | 23 | 1130 | ||
| 8 | Instagram Users | Absolute | 10,458,072 | 24 | 1130 | ||
| 9 | LinkedIn users | # People | 7,145,162 | 25 | 1126 | ||
| 10 | LinkedIn Users as a % of Total LinkedIn Users | % People | 0 | 25 | 1130 | ||
| 11 | Internet Users | # People | 28,543,790 | 29 | 1129 | ||
| 12 | Facebook CPC in Rs. | Absolute | 5 | 37 | 1130 | ||
| 13 | FB Users / Total Int. Users %. | % People | 34 | 47 | 1126 | ||
| 14 | Instagram Users as a % of Total Population | % People | 29 | 61 | 1125 | ||
| 15 | Instagram Users as a % of Total Internet Users | % People | 36 | 85 | 1128 | ||
|
Below World Average |
|||||||
| 1 | LinkedIn Users as a % of Total Internet Users | % People | 37 | 85 | 1235 | ||
| 2 | LinkedIn Users as a % of Total Population | % People | 34 | 72 | 1235 | ||
| 3 | X (Twitter) Users as a % of Total Internet Users | % People | 12 | 63 | 1230 | ||
| 4 | X (Twitter) Users as a % of Total Population | % People | 13 | 50 | 1232 | ||
| Sr. | Title | Metric | World Average | Rank out of 195 | Value | ||
|---|---|---|---|---|---|---|---|
|
Above World Average |
|||||||
| 1 | Theaters/Total Theaters %. | Percent | 0 | 21 | 1130 | ||
| 2 | # Mobile phone numbers | Count | 40,393,496 | 34 | 1127 | ||
| 3 | # Phone Numbers /Total Pop. % | Percent | 101 | 34 | 1126 | ||
|
Below World Average |
|||||||
| 1 | Theaters per 100000 | Ratio | 1 | 39 | 1231 | ||
| 2 | # Theaters | Count | 310 | 21 | 1234 | ||
| Sr. | Title | Metric | World Average | Rank out of 195 | Value | ||
|---|---|---|---|---|---|---|---|
|
Above World Average |
|||||||
| 1 | Total Military Force | # People | 362,682 | 24 | 1127 | ||
| 2 | Military Force/Total World Military Force %. | % People | 0 | 24 | 1130 | ||
|
Below World Average |
|||||||
| 1 | Judges Per 100K | People Per 100K | 11 | 81 | 1233 | ||
| 2 | Military Budget/Total World Military Budget %. | Percent | 0 | 47 | 1233 | ||
| 3 | Military Budget (in Billion $) | $ Billion | 17 | 47 | 1231 | ||
| 4 | Military Force/Total Pop. % | % People | 1 | 36 | 1230 | ||
| 5 | Police Officers | # People | 138,224 | 28 | 1230 | ||
| Sr. | Title | Metric | World Average | Rank out of 195 | Value | ||
|---|---|---|---|---|---|---|---|
|
Above World Average |
|||||||
| 1 | Formal Jobs | # People | 10,605,934 | 30 | 1128 | ||
| 2 | Non-Agricultural Labour Force | # People | 15,067,127 | 31 | 1129 | ||
| 3 | Employment in Services | # People | 10,251,634 | 34 | 1129 | ||
| 4 | Total Labour Force/Total Pop. | % People | 43 | 45 | 1129 | ||
| 5 | Employment in Services /Total pop.%. | % People | 25 | 55 | 1125 | ||
| 6 | Non-Agri Labour force/Total Labour force %. | % People | 76 | 66 | 1126 | ||
| 7 | Wage & Salaried Workers / Total Labour Force % | % People | 59 | 69 | 1130 | ||
| 8 | Employment in Services / Total Labour Force %. | % People | 57 | 80 | 1125 | ||
| 9 | Employment in services/Total Labour force %. | % People | 56 | 80 | 1126 | ||
|
Below World Average |
|||||||
| 1 | Employment in Agri. / Total Labour Force % . | % People | 23 | 113 | 1230 | ||
| 2 | Employment in Agriculture/Total Labour force %. | % People | 23 | 113 | 1233 | ||
| 3 | Employment in Agriculture /Total Pop. %. | % People | 9 | 102 | 1235 | ||
| 4 | Unemployment Rate. | % People | 6 | 86 | 1231 | ||
| 5 | Employment in Agriculture | # People | 5,314,003 | 56 | 1231 | ||
| 6 | Total Labour Force (2021) | # People | 20,641,663 | 36 | 1234 | ||
| 7 | Unemployed Labour Force. | # People | 1,511,199 | 36 | 1230 | ||
| 8 | Labour Force Participation | # People | 14,659,929 | 30 | 1233 | ||
| Sr. | Title | Metric | World Average | Rank out of 195 | Value | ||
|---|---|---|---|---|---|---|---|
|
Above World Average |
|||||||
| 1 | Teachers in secondary edu. | # People | 201,153 | 31 | 1129 | ||
| 2 | Literacy Rate (%) | % People | 86 | 102 | 1128 | ||
|
Below World Average |
|||||||
| 1 | # Students per teacher in secondary edu. | Ratio | 57 | 126 | 1230 | ||
| 2 | Teachers as a % of Enrolment | % People | 41 | 72 | 1230 | ||
| 3 | # Students per teacher in tertiary edu. | Ratio | 58 | 58 | 1230 | ||
| 4 | Enrolment in Secondary Edu./Total Literate Pop. | % People | 28 | 110 | 1234 | ||
| 5 | Enrolment in Primary Edu./ Total Literate Pop %. | % People | 36 | 103 | 1231 | ||
| 6 | Enrolment in Primary Edu./Total Pop %. | % People | 27 | 102 | 1235 | ||
| 7 | Enrolment in Secondary Edu./Total Pop %. | % People | 23 | 95 | 1232 | ||
| 8 | # Total Teachers (Primary+Secondary+Tertiary) | # People | 2,895,876 | 32 | 1235 | ||
| 9 | Enrolment in Tertiary Edu./ Total Pop. %. | % People | 9 | 47 | 1235 | ||
| 10 | Enrolment in Tertiary Edu/Total Literate Pop. %. | % People | 9 | 45 | 1234 | ||
| 11 | # Total Students (Primary+Secondary+Tertiary) | # People | 38,831,325 | 43 | 1234 | ||
| 12 | # Students per teacher in Primary edu. | Ratio | 260 | 44 | 1231 | ||
| 13 | Teachers in primary edu. | # People | 112,672 | 62 | 1235 | ||
| 14 | Enrolment in primary edu. | # People | 3,831,465 | 49 | 1235 | ||
| 15 | Enrolment in secondary edu. | # People | 3,225,437 | 41 | 1235 | ||
| 16 | Total Literate Pop. | # People | 34,678,001 | 39 | 1230 | ||
| 17 | Enrolment in tertiary edu.(all programmes) | # People | 1,420,982 | 34 | 1235 | ||
| 18 | Teachers in tertiary edu. | # People | 80,879 | 27 | 1234 | ||
| Sr. | Title | Metric | World Average | Rank out of 195 | Value | ||
|---|---|---|---|---|---|---|---|
|
Above World Average |
|||||||
| 1 | Total No. of Doctors | # People | 78,648 | 33 | 1127 | ||
| 2 | Life Expectancy at Birth, both sexes | Age | 73 | 65 | 1127 | ||
|
Below World Average |
|||||||
| 1 | Total No. of Pharmacists | # People | 19,528 | 34 | 1230 | ||
Mother Tongue : Malay
Literacy Rate (%) : 95.00
| Country Capital | : | Negurlmud |
|---|---|---|
| GDP Per Capita | : | 13,145 |
| GDP Per Capita Rank | : | 71st/195 |
| Life Expectancy | : | 77 |
| Unemployment Rate | : | 3 |
| Number of Internet Users | : | 35,544,619 |
| Internet Users Rank | : | 29th/195 |
| Area | : | 460 |
| Area Rank | : | 180th/195 |
| Total Population | : | 36,385,115 |
| Total Population Rank | : | 45th/195 |
| Sr. | City | Total City Population (2023) |
|---|---|---|
| 1 | Alor Gajah | 224,729 |
| 2 | Alor Setar | 524,627 |
| 3 | Ampang Jaya | 606,782 |
| 4 | Baling | 171,167 |
| 5 | Batu Pahat | 271,046 |
| 6 | Beluran | 135,200 |
| 7 | Bentong | 148,008 |
| 8 | Besut | 176,730 |
| 9 | Dungun | 193,937 |
| 10 | Ipoh | 851,176 |
| 11 | Jasin | 170,132 |
| 12 | Johor Bahru | 643,137 |
| 13 | Johor Bahru Tengah | 684,538 |
| 14 | Kajang | 1,030,494 |
| 15 | Kangar | 291,876 |
| 16 | Kapit | 143,221 |
| 17 | Kemaman | 215,802 |
| 18 | Keningau | 223,953 |
| 19 | Kerian | 155,512 |
| 20 | Kinabatangan | 235,856 |
| 21 | Klang | 962,700 |
| 22 | Kluang | 217,096 |
| 23 | Kota Bharu Bandaraya Islam | 407,540 |
| 24 | Kota Kinabalu | 584,917 |
| 25 | Kota Marudu / Pitas | 134,812 |
| 26 | Kuala Kangsar | 684,538 |
| 27 | Kuala Langat | 284,890 |
| 28 | Kuala Lumpur | 2,055,554 |
| 29 | Kuala Selangor | 265,613 |
| 30 | Kuala Terengganu | 436,779 |
| 31 | Kuantan | 553,090 |
| 32 | Kubang Pasu | 277,515 |
| 33 | Kuching Selatan | 206,358 |
| 34 | Kuching Utara | 214,250 |
| 35 | Kulai | 303,391 |
| 36 | Kulim | 363,940 |
| 37 | Lahad Datu | 258,497 |
| 38 | Manjung | 273,116 |
| 39 | Maran | 143,739 |
| 40 | Melaka Bandraya Bersejarah | 627,353 |
| 41 | Miri | 303,391 |
| 42 | Muar | 260,179 |
| 43 | Nilai | 260,049 |
| 44 | Padawan | 353,848 |
| 45 | Papar | 160,946 |
| 46 | Pasir Mas | 234,044 |
| 47 | Pasir Puteh | 146,456 |
| 48 | Pekan | 134,294 |
| 49 | Penampang | 143,739 |
| 50 | Petaling Jaya | 794,380 |
| 51 | Port Dickson | 130,801 |
| 52 | Rompin | 141,798 |
| 53 | Samarahan | 150,984 |
| 54 | Sandakan | 512,724 |
| 55 | Seberang Perai | 1,058,569 |
| 56 | Segamat | 133,259 |
| 57 | Selayang | 701,745 |
| 58 | Semporna | 172,331 |
| 59 | Sepang | 268,330 |
| 60 | Seremban | 406,893 |
| 61 | Shah Alam | 700,322 |
| 62 | Sibu | 210,498 |
| 63 | Subang Jaya | 916,383 |
| 64 | Sungai Petani | 573,790 |
| 65 | Taiping | 317,234 |
| 66 | Tanah Merah | 149,949 |
| 67 | Tangkak | 170,649 |
| 68 | Tawau | 514,535 |
| 69 | Teluk Intan | 165,733 |
| 70 | Temerloh | 205,323 |
| 71 | Tuaran | 132,483 |
| 72 | Tumpat | 186,045 |
| 73 | Ulu Selangor | 251,510 |
Q - Does Prarang do surveys to collect data? How does Prarang have such granular
Country-level details which no private or public data source offers?
A - Prarang does not conduct surveys to gather data; instead, we rely on publicly available
sources such as UN Population data, the CIA World Factbook, and private surveys whose results
are accessible through news media and public websites. Our data classification follows a
three-fold method rooted in Indian logic (Tarkashastra): Pramana (evidence-based data
collection) involves gathering data from credible sources; Anumana (estimation and inference)
uses modeling to draw inferences from the collected data; and Upamana (comparison) ranks
countries through relative comparison, calculating the Samana (country average) to determine
whether each country ranks above or below this benchmark. All data sources and estimation
modeling methods are transparently detailed and accessible, with information available for each
data field by clicking the "i" icon.
A - Prarang does not do any surveys. It does data modeling & estimations based on third-party census & surveys, already in the public domain. It also shares the source of the data it uses. Users need to make their own judgment of how and for what purpose and when they use the data that they download from this Prarang website.