Saint Vincent and the Grenadines AI Report
Date: June 6, 2025
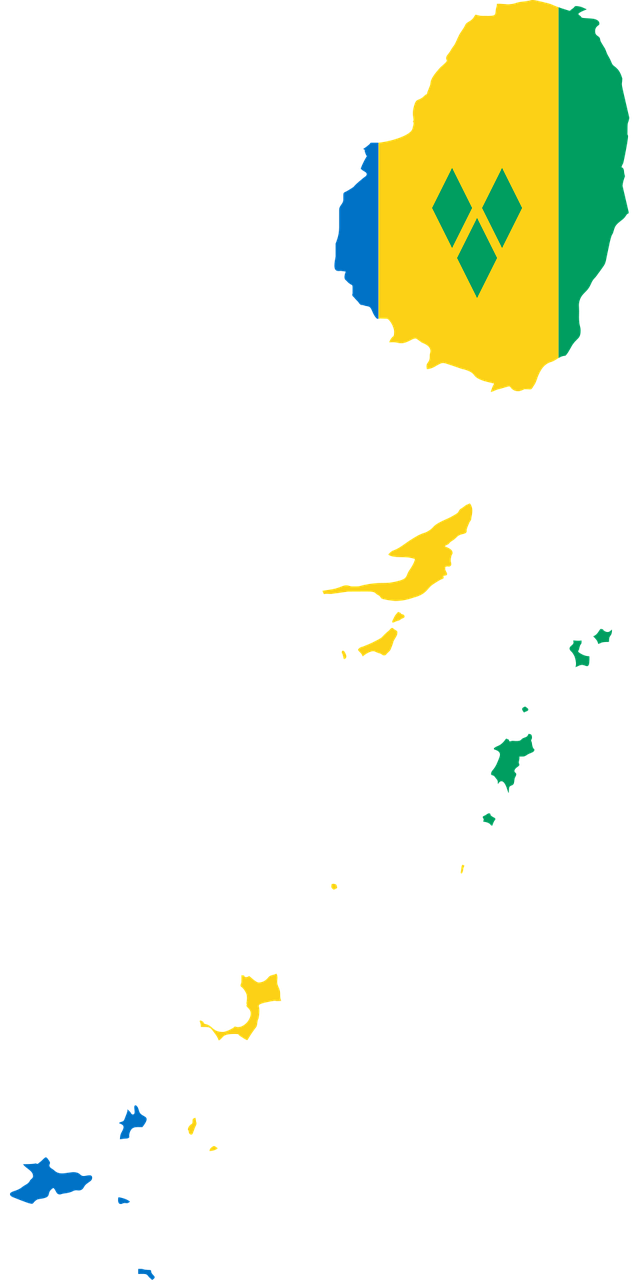
Saint Vincent and the Grenadines is a small country with 0.001% of the world's population. Saint Vincent and the Grenadines is a monarchy country.
Saint Vincent and the Grenadines is the 183rd ranked country in population and 184th ranked in area out of 195 countries in the world.Please keep the country rank in perspective, for the highlights below.

The Average Literacy Rate (%) of 195 countries in the world is 86. Saint Vincent and the Grenadines is the 91st highest ranked country out of 195 countries. This indicates that there is a better educational infrastructure in this country as compared to other countries.


Saint Vincent and the Grenadines is the 10th worst ranked in Total No. of Doctors out of all the 195 countries.This may indicate worse healthcare infrastructure investment by the country or may indicate lower population
Saint Vincent and the Grenadines is the 13th worst ranked in Total Population (2025) out of all the 195 countries.Taking into context the total population of the world, this country is less populated in comparison to other countries.
Out of 195 countries in the world, Saint Vincent and the Grenadines is the 16th worst ranked in Internet Users . This may take into context a lower country population, and implies that there are lesser people with access to the internet when compared to other countries.
Saint Vincent and the Grenadines is the 16th worst ranked in Rural Pop. out of all the 195 countries.This may indicate that there is a high degree of industrialisation, or better urbanisation and development policies in place in comparison to other countries.
Urbanization Metrics
Sr. | Title | Metric | World Average | Rank out of 195 | Value | ||
---|---|---|---|---|---|---|---|
Above than World Average- |
|||||||
1 | Pop. with access to Electricity (%) | % People | 86 | 1 | 1128 | ||
2 | Rural Pop. /Total Pop. % | % People | 40 | 76 | 1129 | ||
Below than World Average- |
|||||||
1 | Rural Pop. | # People | 18,013,759 | 180 | 1235 | ||
2 | Urban Population (2021) | # People | 23,726,053 | 178 | 1230 | ||
3 | Urban Population / Total Population % . | % People | 60 | 120 | 1233 |
Nature Metrics
Sr. | Title | Metric | World Average | Rank out of 195 | Value | ||
---|---|---|---|---|---|---|---|
Above than World Average- |
|||||||
1 | Tree density. | Density | 9 | 1 | 1127 | ||
2 | Tree density . | Density | 8 | 1 | 1128 | ||
Below than World Average- |
|||||||
1 | Chicken Meat Production (in tonnes) | Weight | 588,164 | 176 | 1230 | ||
2 | Number of Cows | Count | 8,697,624 | 175 | 1231 | ||
3 | Cows (% of Total Cows) | Percent | 0 | 175 | 1230 | ||
4 | Cow Beef Production (in tonnes) | Weight | 320,761 | 170 | 1233 | ||
5 | Cow Milk Production (in tonnes) | Weight | 3,855,383 | 169 | 1235 | ||
6 | Forest Area. | Area | 21,142,892 | 168 | 1234 | ||
7 | Number of Trees | Count | 15,642,617,148 | 166 | 1233 | ||
8 | Goat Meat Production (in tonnes) | Weight | 46,111 | 145 | 1233 | ||
9 | Orange Production (in tonnes) | Weight | 618,959 | 108 | 1233 | ||
10 | Sweet Potatoes prod. | Tons | 895,180 | 91 | 1232 | ||
11 | Apple Production (in tonnes) | Weight | 1,044,287 | 84 | 1234 |
Demography Metrics
Sr. | Title | Metric | World Average | Rank out of 195 | Value | ||
---|---|---|---|---|---|---|---|
Above than World Average- |
|||||||
1 | Male % of Total Pop. | % People | 50 | 18 | 1129 | ||
Below than World Average- |
|||||||
1 | Births | # People (In Thousands) | 681 | 182 | 1235 | ||
2 | Female Population (2025) | # People (In Thousands) | 20,993 | 183 | 1231 | ||
3 | Total Population (2025) | # People (In Thousands) | 42,003 | 183 | 1230 | ||
4 | Male Population (2025) | # People (In Thousands) | 21,226 | 182 | 1232 | ||
5 | Population Growth Rate (%) | % People | 0 | 177 | 1230 | ||
6 | Female % of Total Pop. | % People | 50 | 158 | 1233 |
Internet Metrics
Sr. | Title | Metric | World Average | Rank out of 195 | Value | ||
---|---|---|---|---|---|---|---|
Above than World Average- |
|||||||
1 | Facebook CPC in Rs. | Absolute | 5 | 21 | 1127 | ||
2 | FB Users / Total Int. Users %. | % People | 31 | 31 | 1128 | ||
3 | LinkedIn Users as a % of Total Internet Users | % People | 35 | 41 | 1125 | ||
4 | FB Users / Total Pop. %. | % People | 25 | 42 | 1125 | ||
5 | Twitter Users as a % of Total Internet Users | % People | 14 | 44 | 1128 | ||
6 | LinkedIn Users as a % of Total Population | % People | 31 | 48 | 1126 | ||
7 | Twitter Users as a % of Total Population | % People | 13 | 51 | 1126 | ||
8 | Int. Users / Total Pop.% | % People | 70 | 98 | 1127 | ||
Below than World Average- |
|||||||
1 | Internet Users | # People | 28,408,774 | 180 | 1233 | ||
2 | LinkedIn users | # People | 6,388,891 | 172 | 1233 | ||
3 | Facebook users | # People | 6,757,917 | 164 | 1230 | ||
4 | Twitter users | # People | 3,173,740 | 163 | 1235 |
Work Metrics
Sr. | Title | Metric | World Average | Rank out of 195 | Value | ||
---|---|---|---|---|---|---|---|
Above than World Average- |
|||||||
1 | Employment in Services /Total pop.%. | % People | 25 | 39 | 1130 | ||
2 | Employment in Services / Total Labour Force %. | % People | 56 | 42 | 1125 | ||
3 | Employment in services/Total Labour force %. | % People | 56 | 42 | 1128 | ||
4 | Total Labour Force/Total Pop. | % People | 43 | 55 | 1128 | ||
5 | Wage & Salaried Workers / Total Labour Force % | % People | 58 | 62 | 1127 | ||
6 | Non-Agri Labour force/Total Labour force %. | % People | 76 | 65 | 1126 | ||
Below than World Average- |
|||||||
1 | Total Labour Force (2021) | # People | 20,409,734 | 174 | 1231 | ||
2 | Employment in Services | # People | 10,251,634 | 173 | 1230 | ||
3 | Formal Jobs | # People | 10,605,934 | 172 | 1234 | ||
4 | Non-Agricultural Labour Force | # People | 15,067,127 | 172 | 1231 | ||
5 | Employment in Agriculture | # People | 5,314,003 | 168 | 1230 | ||
6 | Employment in Agri. / Total Labour Force % . | % People | 23 | 114 | 1233 | ||
7 | Employment in Agriculture/Total Labour force %. | % People | 23 | 114 | 1232 | ||
8 | Employment in Agriculture /Total Pop. %. | % People | 9 | 103 | 1234 |
Wealth Metrics
Sr. | Title | Metric | World Average | Rank out of 195 | Value | ||
---|---|---|---|---|---|---|---|
Above than World Average- |
|||||||
1 | Corporate Tax Rates in % | Rate | 23 | 54 | 1126 | ||
Below than World Average- |
|||||||
1 | GDP (Billions USD) 2025 | $ Billions | 613 | 175 | 1234 | ||
2 | FDI / Total FDI of the World %. | 0 | 138 | 1232 | |||
3 | FDI (millions USD) | Amount | 3,115 | 139 | 1230 | ||
4 | Import Ban(Number of products) | Count | 12 | 115 | 1235 | ||
5 | GDP Per Capita (USD) | $ | 30,070 | 90 | 1235 |
Education Metrics
Sr. | Title | Metric | World Average | Rank out of 195 | Value | ||
---|---|---|---|---|---|---|---|
Above than World Average- |
|||||||
1 | Literacy Rate (%) | % People | 86 | 91 | 1126 | ||
Below than World Average- |
|||||||
1 | Total Literate Pop. | # People | 34,678,001 | 183 | 1233 | ||
2 | Teachers in secondary edu. | # People | 659,923 | 175 | 1235 | ||
3 | # Students per teacher in Primary edu. | Ratio | 260 | 142 | 1234 | ||
4 | # Students per teacher in secondary edu. | Ratio | 31 | 1 | 1230 | ||
5 | Enrolment in Primary Edu./ Total Literate Pop %. | % People | 36 | 78 | 1235 | ||
6 | Enrolment in Secondary Edu./Total Literate Pop. | % People | 28 | 71 | 1231 | ||
7 | Enrolment in Primary Edu./Total Pop %. | % People | 27 | 64 | 1235 | ||
8 | Enrolment in Secondary Edu./Total Pop %. | % People | 23 | 51 | 1230 | ||
9 | Teachers in primary edu. | # People | 88,812 | 2 | 1235 |
Media Metrics
Sr. | Title | Metric | World Average | Rank out of 195 | Value | ||
---|---|---|---|---|---|---|---|
Above than World Average- |
|||||||
1 | # Phone Numbers /Total Pop. % | Percent | 101 | 94 | 1128 | ||
Below than World Average- |
|||||||
1 | # Mobile phone numbers | Count | 40,393,496 | 177 | 1235 |
Health Metrics
Sr. | Title | Metric | World Average | Rank out of 195 | Value | ||
---|---|---|---|---|---|---|---|
Below than World Average- |
|||||||
1 | Total No. of Doctors | # People | 78,648 | 186 | 1232 | ||
2 | Total No. of Pharmacists | # People | 19,528 | 171 | 1235 | ||
3 | Life Expectancy at Birth, both sexes | Age | 73 | 122 | 1231 | ||
4 | Dentist (per 10,000) | People per 10000 | 31 | 98 | 1230 |
Culture Metrics
Sr. | Title | Metric | World Average | Rank out of 195 | Value | ||
---|---|---|---|---|---|---|---|
Below than World Average- |
|||||||
1 | Islamic Population | # People | 9,936,734 | 155 | 1234 | ||
2 | Islamic Pop./Total Pop.% | % People | 22 | 119 | 1231 |
Governance Metrics
Sr. | Title | Metric | World Average | Rank out of 195 | Value | ||
---|---|---|---|---|---|---|---|
Below than World Average- |
|||||||
1 | Police Officers | # People | 138,224 | 107 | 1232 |
Language Metrics
Sr. | Title | Metric | World Average | Rank out of 195 | Value | ||
---|---|---|---|---|---|---|---|
Below than World Average- |
|||||||
1 | English as a % of total English speakers | % People | 0 | 34 | 1230 | ||
2 | English | # People | 3,175,743 | 32 | 1230 |
LANGUAGES
- Official Language:
- 1. English
: 102,960
Mother Tongue : English
Literacy Rate (%) : 96.00
Country Capital | : | Kingstown |
---|---|---|
GDP Per capita | : | 20,547 |
GDP Per Capita Rank | : | 90th/195 |
Life Expectancy | : | 71 |
Unemployment Rate | : | 0 |
Number of Internet Users | : | 78,491 |
Internet Users Rank | : | 180th/195 |
Area | : | 390 |
Area Rank | : | 184th/195 |
Total Population | : | 100 |
Total Population Rank | : | 183rd/195 |
List of cities having more than 100K population in Saint Vincent and the Grenadines
Sr. | City | Total City Population (2023) |
|||
---|---|---|---|---|---|
No data available. |
Frequently Asked Questions :
Q - Does Prarang do surveys to collect data? How does Prarang have such granular Country-level details which no private or public data source offers?
A - Prarang does not conduct surveys to gather data; instead, we rely on publicly available sources such as UN Population data, the CIA World Factbook, and private surveys whose results are accessible through news media and public websites. Our data classification follows a three-fold method rooted in Indian logic (Tarkashastra): Pramana (evidence-based data collection) involves gathering data from credible sources; Anumana (estimation and inference) uses modeling to draw inferences from the collected data; and Upamana (comparison) ranks countries through relative comparison, calculating the Samana (country average) to determine whether each country ranks above or below this benchmark. All data sources and estimation modeling methods are transparently detailed and accessible, with information available for each data field by clicking the "i" icon.
Q - Does Prarang take responsibility for the absolute data fields that someone buys from it, along with the calculation of the associated ranks?
A - Prarang does not do any surveys. It does data modeling & estimations based on third-party census & surveys, already in the public domain. It also shares the source of the data it uses. Users need to make their own judgment of how and for what purpose and when they use the data that they download from this Prarang website.
Q - What is the frequency of data updates on various data fields of Prarang analytics?
A - We are continuously on the lookout for market announcements of new surveys & new data. You can expect important World survey results to be live on our website, within 30 to 45 days after appearing in press/media. We model on spreadsheets & update our SQL databases, after data validation.