Analytics: World
Analytics: World
Date: June 14, 2026
 United States of America is a large country with 4.3% of the world's population. United States of America is a democratic country. It has 26 world heritage sites. It is home to 10.1% Christians and 37.3% Jews of the world. It produces 5.5% Wheat, 2.5% Barley, 4.9% Potatoes, 32.9% Soyabean, and 2.9% Onions of the world. It is rich in resources and has 16% Oil and 25% Natural Gas of the world.
United States of America is the 3rd ranked country in population and 3rd ranked in area out of 195 countries in the world. Please keep the country rank in perspective, for the highlights below.
 Teachers in tertiary edu.
 Military Budget (in Billion $)
 Natural Gas Prod.
 Oil Prod.
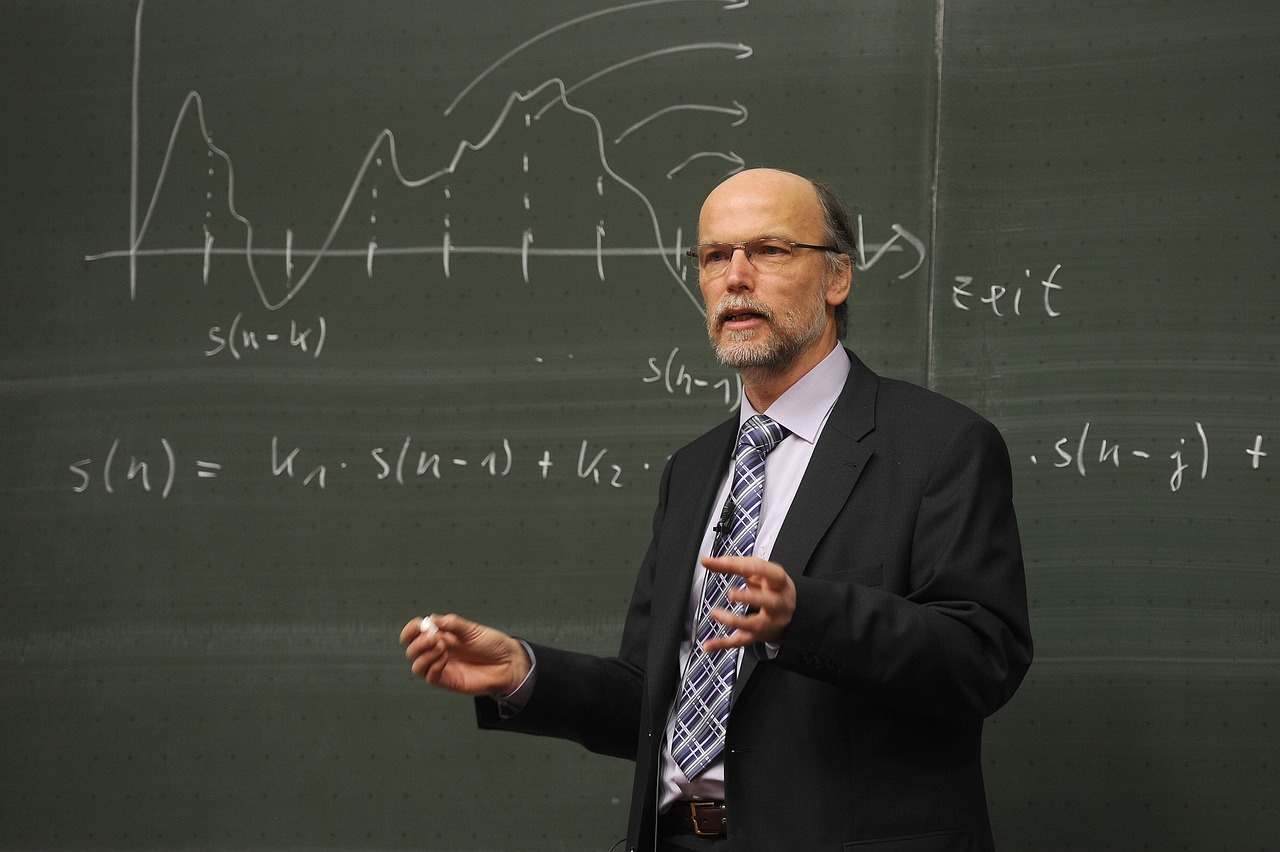
The Average Teachers in tertiary edu. of 195 countries in the world is 80,879. United States of America is the 1st highest ranked country out of 195 countries. This implies better investment by the country in higher education when compared to other countries.
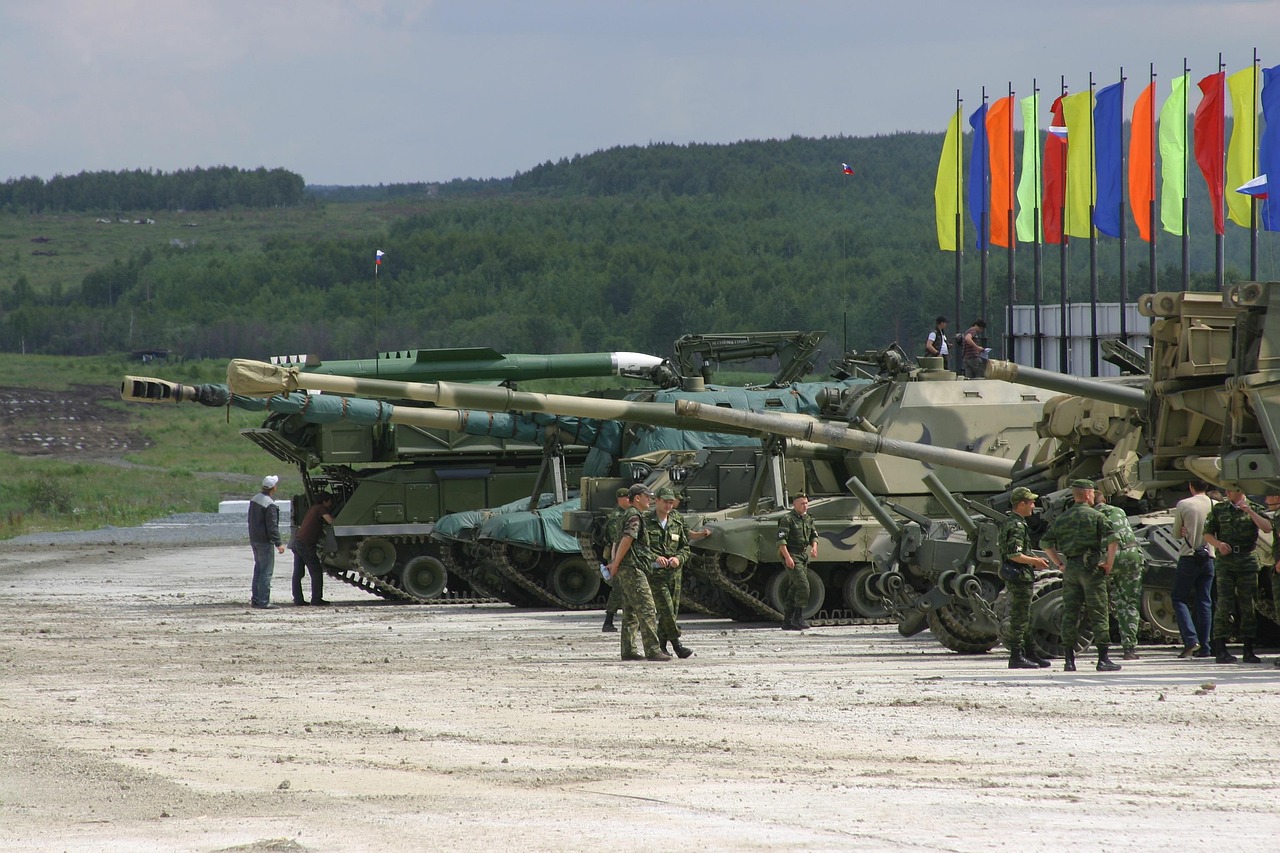
The Average Military Budget (in Billion $) of 195 countries in the world is 17. United States of America is the 1st highest ranked country out of 195 countries. This implies that threats to the country is higher compared to other countries.
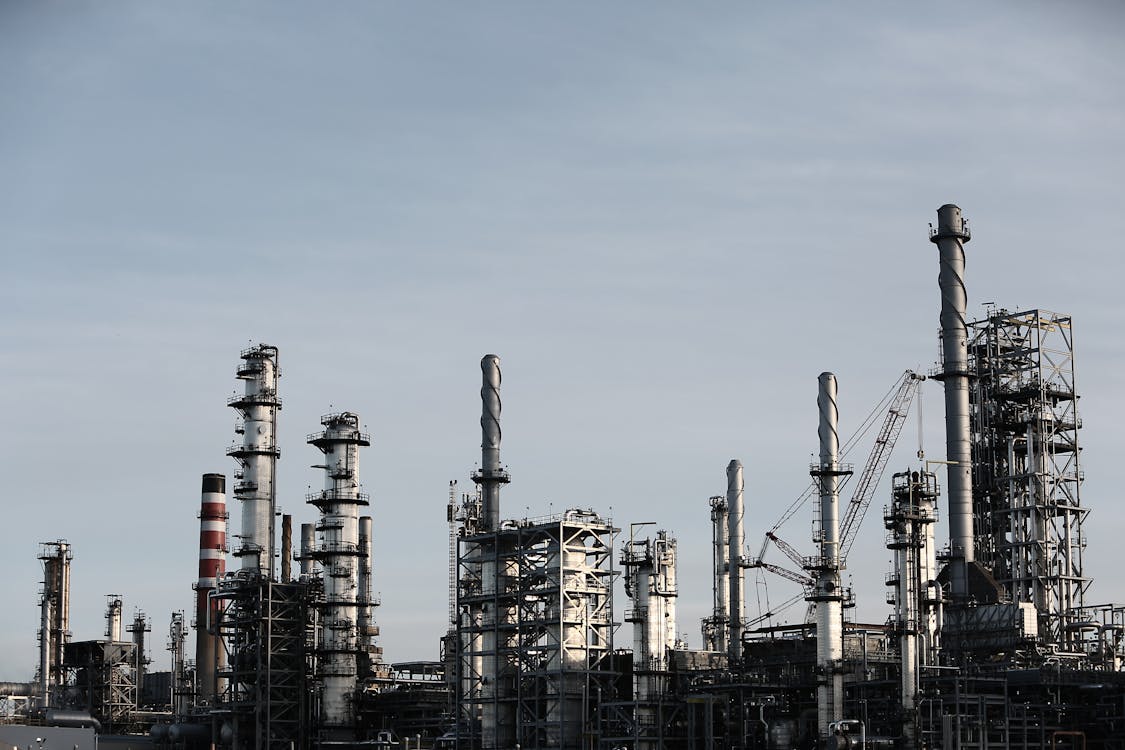
Out of 195 countries in the world, United States of America is the 1st highest ranked in Natural Gas Prod. . This is indicative of a rich reserve of natural resources in comparison to other countries, and may be a huge exporter of such resources.
Out of 195 countries in the world, United States of America is the 1st highest ranked in Oil Prod. . This is indicative of a rich reserve of natural resources in comparison to other countries, and may be a huge exporter of such resources.
 Literacy Rate (%)
 Employment in Agriculture
 Uranium prod.
United States of America is the 60th worst ranked in Literacy Rate (%) out of all the 195 countries.This indicates that the educational infrastructure in this country is worse than it is in other countries.
The Average Employment in Agriculture of 195 countries in the world is 5,314,003. United States of America is the 152nd worst ranked country out of 195 countries. This may indicate that a significant portion of population is living in urban areas or simply imply that the country is developed
The Average Uranium prod. of 195 countries in the world is 3,187. United States of America is the 181st worst ranked country out of 195 countries. This implies that the country does not have significant nuclear programmes or the country does not have huge reserves of Uranium.
| Sr. | Title | Metric | World Average | Rank out of 195 | Value | ||
|---|---|---|---|---|---|---|---|
|
Above World Average |
|||||||
| 1 | English | # People | 10,677,446 | 1 | 1126 | ||
| 2 | English as a % of total English speakers | % People | 0 | 1 | 1126 | ||
| 3 | Tongan | # People | 19,632 | 2 | 1128 | ||
| 4 | Filipino as a % of total Filipino speakers | % People | 0 | 2 | 1128 | ||
| 5 | Haitian Creole as a % of total Haitian Creole speakers | % People | 0 | 2 | 1126 | ||
| 6 | Italian as a % of total Italian speakers | % People | 0 | 2 | 1125 | ||
| 7 | Japanese as a % of total Japanese speakers | % People | 0 | 2 | 1127 | ||
| 8 | Mandarin Chinese as a % of total Mandarin Chinese speakers | % People | 0 | 2 | 1125 | ||
| 9 | Polish as a % of total Polish speakers | % People | 0 | 2 | 1125 | ||
| 10 | Telugu as a % of total Telugu speakers | % People | 0 | 2 | 1129 | ||
| 11 | Tongan as a % of total Tongan speakers | % People | 0 | 2 | 1130 | ||
| 12 | Czech as a % of total Czech speakers | % People | 0 | 3 | 1128 | ||
| 13 | Danish as a % of total Danish speakers | % People | 0 | 3 | 1125 | ||
| 14 | Dutch as a % of total Dutch speakers | % People | 0 | 3 | 1126 | ||
| 15 | Spanish | # People | 16,324,341 | 4 | 1126 | ||
| 16 | Estonian as a % of total Estonian speakers | % People | 0 | 4 | 1127 | ||
| 17 | Korean as a % of total Korean speakers | % People | 0 | 4 | 1129 | ||
| 18 | Slovak as a % of total Slovak speakers | % People | 0 | 4 | 1126 | ||
| 19 | Spanish as a % of total Spanish speakers | % People | 0 | 4 | 1127 | ||
| 20 | Armenian as a % of total Armenian speakers | % People | 0 | 5 | 1127 | ||
| 21 | German as a % of total German speakers | % People | 0 | 5 | 1126 | ||
| 22 | Armenian | # People | 159,989 | 6 | 1128 | ||
| 23 | Albanian as a % of total Albanian speakers | % People | 0 | 6 | 1125 | ||
| 24 | French as a % of total French speakers | % People | 0 | 7 | 1129 | ||
|
Below World Average |
|||||||
| 1 | Malay as a % of total Malay speakers | % People | 0 | 10 | 1230 | ||
| 2 | Malay | # People | 2,434,606 | 10 | 1230 | ||
| 3 | Russian | # People | 7,066,428 | 10 | 1231 | ||
| 4 | Russian as a % of total Russian speakers | % People | 0 | 9 | 1231 | ||
| 5 | Kyrgy | # People | 599,193 | 8 | 1233 | ||
| 6 | French | # People | 3,059,547 | 7 | 1232 | ||
| 7 | Albanian | # People | 267,320 | 6 | 1230 | ||
| 8 | Portuguese | # People | 14,438,442 | 6 | 1233 | ||
| 9 | Afrikaans as a % of total Afrikaans speakers | % People | 0 | 6 | 1230 | ||
| 10 | Portuguese as a % of total Portuguese speakers | % People | 0 | 6 | 1230 | ||
| 11 | Bulgarian | # People | 473,217 | 5 | 1235 | ||
| 12 | Burmese | # People | 3,898,788 | 5 | 1233 | ||
| 13 | Estonian | # People | 115,398 | 5 | 1230 | ||
| 14 | German | # People | 5,121,263 | 5 | 1235 | ||
| 15 | Gujarati | # People | 3,567,082 | 5 | 1230 | ||
| 16 | Standard Chinese | # People | 26,081,662 | 5 | 1232 | ||
| 17 | Swahili | # People | 1,275,639 | 5 | 1232 | ||
| 18 | Bulgarian as a % of total Bulgarian speakers | % People | 0 | 5 | 1235 | ||
| 19 | Burmese as a % of total Burmese speakers | % People | 0 | 5 | 1233 | ||
| 20 | Standard Chinese as a % of total Standard Chinese speakers | % People | 0 | 5 | 1230 | ||
| 21 | Swahili as a % of total Swahili speakers | % People | 0 | 5 | 1230 | ||
| 22 | Hindi | # People | 57,280,639 | 3 | 1235 | ||
| 23 | Indonesian | # People | 3,159,957 | 4 | 1235 | ||
| 24 | Sinhalese | # People | 1,760,650 | 4 | 1234 | ||
| 25 | Slovak | # People | 260,685 | 4 | 1232 | ||
| 26 | Gujarati as a % of total Gujarati speakers | % People | 0 | 4 | 1232 | ||
| 27 | Hindi as a % of total Hindi speakers | % People | 0 | 3 | 1235 | ||
| 28 | Indonesian as a % of total Indonesian speakers | % People | 0 | 4 | 1234 | ||
| 29 | Sinhalese as a % of total Sinhalese speakers | % People | 0 | 4 | 1232 | ||
| 30 | Dutch | # People | 1,479,053 | 3 | 1232 | ||
| 31 | Bengali as a % of total Bengali speakers | % People | 0 | 3 | 1230 | ||
| 32 | Finnish as a % of total Finnish speakers | % People | 0 | 3 | 1231 | ||
| 33 | Malayalam as a % of total Malayalam speakers | % People | 0 | 3 | 1233 | ||
| 34 | Czech | # People | 756,074 | 2 | 1230 | ||
| 35 | Filipino | # People | 5,902,375 | 2 | 1230 | ||
| 36 | Haitian Creole | # People | 1,047,697 | 2 | 1231 | ||
| 37 | Italian | # People | 4,106,100 | 2 | 1233 | ||
| 38 | Japanese | # People | 41,499,666 | 2 | 1234 | ||
| 39 | Polish | # People | 4,654,500 | 2 | 1233 | ||
| Sr. | Title | Metric | World Average | Rank out of 195 | Value | ||
|---|---|---|---|---|---|---|---|
|
Above World Average |
|||||||
| 1 | GDP (Billions USD) | $ Billions | 600 | 1 | 1126 | ||
| 2 | No. of Companies Listed in NYSE | Count | 65 | 1 | 1125 | ||
| 3 | FDI (millions USD) | Amount | 3,288 | 1 | 1128 | ||
| 4 | Import of Goods and Services (in Million $) | Amount | 173,515 | 1 | 1125 | ||
| 5 | GDP as a % of Total GDP | Percent | 0 | 1 | 1127 | ||
| 6 | FDI / Total FDI of the World %. | 0 | 1 | 1127 | |||
| 7 | Imports/Total Imports of the World %. | 0 | 1 | 1129 | |||
| 8 | FTAs in India | # People | 51,254 | 1 | 1128 | ||
| 9 | INDs via Hyderabad Airport (%) | % People | 3 | 1 | 1126 | ||
| 10 | Export of Goods and Services (in Million $) | Amount | 180,704 | 2 | 1126 | ||
| 11 | Exports /Total Exports of the World %. | 0 | 2 | 1127 | |||
| 12 | INDs from India | # People | 158,494 | 3 | 1130 | ||
| 13 | GDP Per Capita (USD) | $ | 18,044 | 7 | 1127 | ||
| 14 | FTAs in India - Indian Diaspora (%) | % People | 14 | 7 | 1130 | ||
| 15 | GDP Per Capita at PPP (USD) | $ | 30,199 | 9 | 1125 | ||
| 16 | FTAs in India via Hyderabad (%) | % People | 3 | 11 | 1127 | ||
| 17 | FTAs in India via Bengaluru (%) | % People | 6 | 13 | 1130 | ||
| 18 | INDs via Bengaluru Airport (%) | % People | 5 | 14 | 1130 | ||
| 19 | Import Ban(Number of products) | Count | 12 | 19 | 1128 | ||
| 20 | INDs for Education (%) | % People | 3 | 22 | 1129 | ||
| 21 | INDs via Ahmedabad Airport (%) | % People | 1 | 24 | 1126 | ||
| 22 | INDs via Chennai Airport (%) | % People | 5 | 27 | 1129 | ||
| 23 | FTAs in India via Chennai (%) | % People | 5 | 33 | 1127 | ||
| 24 | FTAs in India via Cochin (%) | % People | 3 | 39 | 1126 | ||
| 25 | INDs - Indian Diaspora (%) | % People | 22 | 63 | 1125 | ||
| 26 | Corporate Tax Rates in % | Rate | 23 | 72 | 1127 | ||
|
Below World Average |
|||||||
| 1 | Exports/Total GDP of the Country %. | 48 | 161 | 1232 | |||
| 2 | Imports /Total GDP of the Country %. | 51 | 159 | 1233 | |||
| 3 | FTAs in India for Business (%) | % People | 18 | 146 | 1232 | ||
| 4 | FTAs in India via Delhi (%) | % People | 46 | 140 | 1233 | ||
| 5 | INDs via Delhi Airport (%) | % People | 38 | 117 | 1235 | ||
| 6 | INDs via Cochin Airport (%) | % People | 3 | 86 | 1233 | ||
| 7 | FTAs in India for Leisure (%) | % People | 42 | 116 | 1235 | ||
| 8 | INDs via Mumbai Airport (%) | % People | 33 | 113 | 1231 | ||
| 9 | INDs for Business (%) | % People | 25 | 104 | 1231 | ||
| 10 | INDs for Leisure (%) | % People | 46 | 103 | 1231 | ||
| 11 | INDs via Trivandrum Airport (%) | % People | 1 | 44 | 1234 | ||
| 12 | INDs via Kolkata Airport (%) | % People | 2 | 54 | 1230 | ||
| 13 | FTAs in India via Mumbai (%) | % People | 23 | 82 | 1233 | ||
| 14 | FTAs in India via Kolkata (%) | % People | 2 | 43 | 1235 | ||
| Sr. | Title | Metric | World Average | Rank out of 195 | Value | ||
|---|---|---|---|---|---|---|---|
|
Above World Average |
|||||||
| 1 | Teachers in tertiary edu. | # People | 80,879 | 1 | 1127 | ||
| 2 | Teachers in primary edu. | # People | 112,672 | 2 | 1129 | ||
| 3 | Enrolment in tertiary edu.(all programmes) | # People | 1,420,982 | 3 | 1126 | ||
| 4 | Teachers in secondary edu. | # People | 201,153 | 3 | 1125 | ||
| 5 | Total Literate Pop. | # People | 34,678,001 | 3 | 1129 | ||
| 6 | # Total Teachers (Primary+Secondary+Tertiary) | # People | 2,895,876 | 3 | 1127 | ||
| 7 | # Total Students (Primary+Secondary+Tertiary) | # People | 38,831,325 | 3 | 1129 | ||
| 8 | Enrolment in secondary edu. | # People | 3,225,437 | 4 | 1129 | ||
| 9 | Enrolment in primary edu. | # People | 3,831,465 | 6 | 1127 | ||
|
Below World Average |
|||||||
| 1 | # Students per teacher in Primary edu. | Ratio | 260 | 138 | 1231 | ||
| 2 | # Students per teacher in tertiary edu. | Ratio | 58 | 86 | 1230 | ||
| 3 | Enrolment in Primary Edu./Total Pop %. | % People | 27 | 137 | 1232 | ||
| 4 | Literacy Rate (%) | % People | 86 | 136 | 1232 | ||
| 5 | Enrolment in Primary Edu./ Total Literate Pop %. | % People | 36 | 126 | 1232 | ||
| 6 | Teachers as a % of Enrolment | % People | 41 | 49 | 1235 | ||
| 7 | Enrolment in Secondary Edu./Total Pop %. | % People | 23 | 105 | 1231 | ||
| 8 | # Students per teacher in secondary edu. | Ratio | 57 | 90 | 1234 | ||
| 9 | Enrolment in Secondary Edu./Total Literate Pop. | % People | 28 | 96 | 1230 | ||
| 10 | Enrolment in Tertiary Edu./ Total Pop. %. | % People | 9 | 9 | 1231 | ||
| 11 | Enrolment in Tertiary Edu/Total Literate Pop. %. | % People | 9 | 7 | 1233 | ||
| Sr. | Title | Metric | World Average | Rank out of 195 | Value | ||
|---|---|---|---|---|---|---|---|
|
Above World Average |
|||||||
| 1 | Military Budget (in Billion $) | $ Billion | 17 | 1 | 1126 | ||
| 2 | Military Budget/Total World Military Budget %. | Percent | 0 | 1 | 1125 | ||
| 3 | Lawyers Per 100K | People Per 100K | 137 | 5 | 1126 | ||
| 4 | Police Officers | # People | 138,224 | 5 | 1129 | ||
| 5 | Total Military Force | # People | 362,682 | 7 | 1128 | ||
| 6 | Military Force/Total World Military Force %. | % People | 0 | 7 | 1128 | ||
|
Below World Average |
|||||||
| 1 | Military Force/Total Pop. % | % People | 1 | 69 | 1235 | ||
| 2 | Judges Per 100K | People Per 100K | 11 | 37 | 1230 | ||
| Sr. | Title | Metric | World Average | Rank out of 195 | Value | ||
|---|---|---|---|---|---|---|---|
|
Above World Average |
|||||||
| 1 | Pop. with access to Electricity (%) | % People | 86 | 1 | 1129 | ||
| 2 | # Cities>100000 | # Cities | 27 | 2 | 1130 | ||
| 3 | Urban Population (2021) | # People | 23,603,754 | 3 | 1130 | ||
| 4 | # Cities>100000 | # Cities | 21 | 3 | 1130 | ||
| 5 | # Cities>300000 | # Cities | 11 | 4 | 1129 | ||
| 6 | # Cities>500000 | # Cities | 7 | 4 | 1128 | ||
| 7 | # Cities>300000 | # Cities | 7 | 6 | 1127 | ||
| 8 | # Cities>500000 | # Cities | 4 | 6 | 1130 | ||
| 9 | # Cities>1M | # Cities | 4 | 9 | 1128 | ||
| 10 | # Cities>5M | # Cities | 0 | 9 | 1126 | ||
| 11 | Rural Pop. | # People | 18,013,759 | 10 | 1130 | ||
| 12 | # Cities>1M | # Cities | 1 | 10 | 1128 | ||
| 13 | Urban Population / Total Population % . | % People | 60 | 36 | 1128 | ||
|
Below World Average |
|||||||
| 1 | Rural Pop. /Total Pop. % | % People | 40 | 160 | 1230 | ||
| 2 | # Cities>5M | # Cities | 1 | 11 | 1234 | ||
| Sr. | Title | Metric | World Average | Rank out of 195 | Value | ||
|---|---|---|---|---|---|---|---|
|
Above World Average |
|||||||
| 1 | # Theaters | Count | 310 | 1 | 1130 | ||
| 2 | Theaters/Total Theaters %. | Percent | 0 | 1 | 1128 | ||
| 3 | # Mobile phone numbers | Count | 40,393,496 | 4 | 1129 | ||
| 4 | Theaters per 100000 | Ratio | 1 | 15 | 1126 | ||
| 5 | # Phone Numbers /Total Pop. % | Percent | 101 | 69 | 1126 | ||
| Sr. | Title | Metric | World Average | Rank out of 195 | Value | ||
|---|---|---|---|---|---|---|---|
|
Above World Average |
|||||||
| 1 | # Olympic Medals | Count | 146 | 1 | 1127 | ||
| 2 | Christian Population | # People | 16,917,912 | 1 | 1127 | ||
| 3 | Gold Medal | Count | 5 | 1 | 1129 | ||
| 4 | Silver Medal | Count | 5 | 1 | 1127 | ||
| 5 | Bronze Medal | Count | 5 | 1 | 1130 | ||
| 6 | Total Medals | Count | 12 | 1 | 1125 | ||
| 7 | Christian Pop./Total Christian Pop.% | % People | 0 | 1 | 1129 | ||
| 8 | Jewish Population | # People | 162,421 | 2 | 1129 | ||
| 9 | Jewish Pop./Total Pop.% | % People | 0 | 2 | 1125 | ||
| 10 | Jewish Pop./Total Jewish Pop. % | % People | 0 | 2 | 1130 | ||
| 11 | # Cannes Grand Prizes (Palme d'Or or Grand Prix) | 4 | 2 | 1125 | |||
| 12 | Share of Cannes Grand Prize Wins (% World) | 3 | 2 | 1125 | |||
| 13 | World Heritage Sites | Count | 7 | 11 | 1125 | ||
| 14 | Christian Pop./Total Pop.% | % People | 42 | 70 | 1126 | ||
|
Below World Average |
|||||||
| 1 | Islamic Pop./Total Pop.% | % People | 22 | 131 | 1235 | ||
| 2 | Islamic Population | # People | 10,091,996 | 56 | 1232 | ||
| 3 | Islamic Pop./Total Islamic Pop.% | % People | 0 | 55 | 1230 | ||
| 4 | Hindu Pop./Total Pop.%. | % People | 2 | 22 | 1235 | ||
| 5 | # FIFA World Cup Third-Place Finishes | 1 | 7 | 1235 | |||
| 6 | Hindu Population | # People | 52,631,217 | 8 | 1231 | ||
| 7 | Hindu Pop./Total Hindu Pop.% | % People | 0 | 8 | 1232 | ||
| Sr. | Title | Metric | World Average | Rank out of 195 | Value | ||
|---|---|---|---|---|---|---|---|
|
Above World Average |
|||||||
| 1 | Natural Gas Prod. | Million cubic meters | 43,738 | 1 | 1126 | ||
| 2 | Oil Prod. | Barrels/day | 855,887 | 1 | 1128 | ||
| 3 | Natural Gas Produced/Total Natural Gas Produced % | Mass | 5 | 1 | 1130 | ||
| 4 | Oil Prodcuced/Total Oil Produced % | 5 | 1 | 1130 | |||
| 5 | Soyabean prod. | Tons | 3,572,369 | 2 | 1125 | ||
| 6 | Soyabean Produced/Total Soyabean Produced % | Weight | 1 | 2 | 1126 | ||
| 7 | Apple Production (in tonnes) | Weight | 1,044,287 | 2 | 1125 | ||
| 8 | Apple Production (% of Total Apple Production) | Percent | 1 | 2 | 1127 | ||
| 9 | Number of Cows | Count | 8,697,624 | 3 | 1127 | ||
| 10 | Cows (% of Total Cows) | Percent | 0 | 3 | 1126 | ||
| 11 | Wheat prod. | Tons | 6,811,171 | 4 | 1125 | ||
| 12 | Onion prod. | Tons | 819,042 | 4 | 1127 | ||
| 13 | Forest Area. | Area | 21,595,147 | 4 | 1130 | ||
| 14 | Country forest area / Global Forest area % | 0 | 4 | 1128 | |||
| 15 | Wheat Produced /Total Wheat Produced. %. | Weight | 0 | 4 | 1129 | ||
| 16 | Onion Produced/Total Onion Produced % | Weight | 0 | 4 | 1126 | ||
| 17 | Cotton Production (in 1000 480 lb. Bales) | Weight | 1,707 | 4 | 1129 | ||
| 18 | Cotton Production (% of Total Cotton Production) | Percent | 1 | 4 | 1130 | ||
| 19 | Potatoes prod. | Tons | 2,504,846 | 5 | 1129 | ||
| 20 | Gold Prod. | Weight | 125 | 5 | 1129 | ||
| 21 | Potatoes Produced /Total Potatoes Produced % | Weight | 0 | 5 | 1125 | ||
| 22 | Gold Produced/Total Gold Produced %. | 4 | 5 | 1129 | |||
| 23 | Sugarcane prod. | Tons | 20,929,075 | 9 | 1128 | ||
| 24 | Orange Production (in tonnes) | Weight | 618,959 | 9 | 1130 | ||
| 25 | Orange Production (% of Total Orange Production) | Percent | 0 | 9 | 1126 | ||
| 26 | Sweet Potatoes prod. | Tons | 878,129 | 10 | 1128 | ||
| 27 | Sweet Potatoes Produced/Total Sweet Potatoes Produced % | Weight | 0 | 10 | 1127 | ||
| 28 | Honey prod. | Tons | 15,393 | 11 | 1130 | ||
| 29 | Honey Produced /Total Honey Produced % | Weight | 0 | 11 | 1130 | ||
| 30 | Barley prod. | Tons | 1,545,003 | 12 | 1130 | ||
| 31 | Barley Produced/Total Barley Produced.% | Weight | 1 | 12 | 1129 | ||
| 32 | Rice prod. | Tons | 6,920,442 | 14 | 1130 | ||
| 33 | Rice Produced/Total Rice Produced.% | Weight | 0 | 14 | 1125 | ||
| 34 | Tree density. | Density | 22,685 | 87 | 1129 | ||
| 35 | Number of Trees | Count | 15,642,617,148 | 122 | 1128 | ||
|
Below World Average |
|||||||
| 1 | Uranium Produced/Total Uranium Produced % | Weight | 5 | 15 | 1230 | ||
| 2 | Goat Meat Production (in tonnes) | Weight | 46,111 | 159 | 1235 | ||
| 3 | Cow Beef Production (% of Total Cow Beef Production) | Percent | 0 | 130 | 1230 | ||
| 4 | Cow Beef Production (in tonnes) | Weight | 320,761 | 136 | 1230 | ||
| 5 | Chicken Meat Production (% of Total Chicken Meat Production) | Percent | 0 | 118 | 1230 | ||
| 6 | Chicken Meat Production (in tonnes) | Weight | 588,164 | 126 | 1233 | ||
| 7 | Cow Milk Production (% of Total Cow Milk Production) | Percent | 0 | 106 | 1234 | ||
| 8 | Cow Milk Production (in tonnes) | Weight | 3,855,383 | 109 | 1233 | ||
| 9 | Goat Milk Production (in tonnes) | Weight | 196,989 | 104 | 1234 | ||
| 10 | Tree density . | Density | 828 | 46 | 1231 | ||
| 11 | Uranium prod. | Tons | 3,187 | 15 | 1232 | ||
| 12 | Sugarcane Produced/Total Sugarcane Produced.% | Weight | 2 | 9 | 1231 | ||
| 13 | Iron Production (in 1000 metric tons) | Weight | 33,258 | 9 | 1233 | ||
| 14 | Iron Production (% of Total Iron Production) | Percent | 2 | 9 | 1230 | ||
| Sr. | Title | Metric | World Average | Rank out of 195 | Value | ||
|---|---|---|---|---|---|---|---|
|
Above World Average |
|||||||
| 1 | LinkedIn users | # People | 7,145,162 | 1 | 1126 | ||
| 2 | LinkedIn Users as a % of Total LinkedIn Users | % People | 0 | 1 | 1130 | ||
| 3 | Facebook users | # People | 11,706,915 | 2 | 1129 | ||
| 4 | Facebook Users as a % of Total facebook Users | % People | 0 | 2 | 1126 | ||
| 5 | Instagram Users | Absolute | 10,458,072 | 2 | 1126 | ||
| 6 | Instagram Users as a % of Total Instagram Users | % People | 0 | 2 | 1125 | ||
| 7 | Internet Users | # People | 28,543,790 | 3 | 1125 | ||
| 8 | LinkedIn Users as a % of Total Population | % People | 34 | 7 | 1125 | ||
| 9 | LinkedIn Users as a % of Total Internet Users | % People | 37 | 10 | 1126 | ||
| 10 | Int. Users / Total Pop.% | % People | 69 | 16 | 1129 | ||
| 11 | Instagram Users as a % of Total Population | % People | 29 | 34 | 1130 | ||
| 12 | FB Users / Total Pop. %. | % People | 27 | 40 | 1126 | ||
| 13 | Instagram Users as a % of Total Internet Users | % People | 36 | 56 | 1126 | ||
| 14 | FB Users / Total Int. Users %. | % People | 34 | 69 | 1128 | ||
|
Below World Average |
|||||||
| 1 | Facebook CPC in Rs. | Absolute | 5 | 97 | 1232 | ||
| Sr. | Title | Metric | World Average | Rank out of 195 | Value | ||
|---|---|---|---|---|---|---|---|
|
Above World Average |
|||||||
| 1 | Labour Force Participation | # People | 14,659,929 | 2 | 1126 | ||
| 2 | Formal Jobs | # People | 10,605,934 | 2 | 1125 | ||
| 3 | Total Labour Force (2021) | # People | 20,641,663 | 3 | 1126 | ||
| 4 | Employment in Services | # People | 10,251,634 | 3 | 1126 | ||
| 5 | Non-Agricultural Labour Force | # People | 15,067,127 | 3 | 1125 | ||
| 6 | Unemployed Labour Force. | # People | 1,511,199 | 5 | 1126 | ||
| 7 | Wage & Salaried Workers / Total Labour Force % | % People | 59 | 8 | 1127 | ||
| 8 | Non-Agri Labour force/Total Labour force %. | % People | 76 | 14 | 1130 | ||
| 9 | Employment in Services / Total Labour Force %. | % People | 57 | 15 | 1130 | ||
| 10 | Employment in services/Total Labour force %. | % People | 56 | 15 | 1129 | ||
| 11 | Employment in Services /Total pop.%. | % People | 25 | 25 | 1128 | ||
| 12 | Total Labour Force/Total Pop. | % People | 43 | 52 | 1126 | ||
|
Below World Average |
|||||||
| 1 | Employment in Agri. / Total Labour Force % . | % People | 23 | 165 | 1230 | ||
| 2 | Employment in Agriculture/Total Labour force %. | % People | 23 | 165 | 1230 | ||
| 3 | Employment in Agriculture /Total Pop. %. | % People | 9 | 164 | 1235 | ||
| 4 | Unemployment Rate. | % People | 6 | 90 | 1230 | ||
| 5 | Employment in Agriculture | # People | 5,314,003 | 44 | 1235 | ||
| Sr. | Title | Metric | World Average | Rank out of 195 | Value | ||
|---|---|---|---|---|---|---|---|
|
Above World Average |
|||||||
| 1 | Total No. of Doctors | # People | 78,648 | 2 | 1128 | ||
| 2 | Total No. of Pharmacists | # People | 19,528 | 3 | 1127 | ||
| 3 | Life Expectancy at Birth, both sexes | Age | 73 | 45 | 1127 | ||
|
Below World Average |
|||||||
| 1 | Dentist (per 10,000) | People per 10000 | 31 | 71 | 1231 | ||
| Sr. | Title | Metric | World Average | Rank out of 195 | Value | ||
|---|---|---|---|---|---|---|---|
|
Above World Average |
|||||||
| 1 | Total Population | # People | 42,357,833 | 3 | 1129 | ||
| 2 | Male Population | # People | 21,291,067 | 3 | 1126 | ||
| 3 | Female Population | # People | 21,066,765 | 3 | 1129 | ||
| 4 | Total Births | # People | 677,551 | 8 | 1128 | ||
| 5 | Total Deaths | # People | 321,991 | 3 | 1129 | ||
|
Below World Average |
|||||||
| 1 | Female % of Total Pop. | % People | 50 | 141 | 1232 | ||
| 2 | Population Growth Rate (%) | % People | 0 | 123 | 1232 | ||
| 3 | Male % of Total Pop. | % People | 50 | 55 | 1232 | ||
Mother Tongue : English
Literacy Rate (%) : 86.00
| Country Capital | : | Washington D.C |
|---|---|---|
| GDP Per Capita | : | 89,105 |
| GDP Per Capita Rank | : | 8th/195 |
| Life Expectancy | : | 79 |
| Unemployment Rate | : | 3 |
| Number of Internet Users | : | 339,018,175 |
| Internet Users Rank | : | 3rd/195 |
| Area | : | 9,147,601 |
| Area Rank | : | 3rd/195 |
| Total Population | : | 349,035,494 |
| Total Population Rank | : | 3rd/195 |
| Sr. | City | Total City Population (2023) |
|---|---|---|
| 1 | New York | 8,887,447 |
| 2 | Los Angeles | 3,935,615 |
| 3 | Chicago | 2,772,359 |
| 4 | Houston | 2,326,373 |
| 5 | Phoenix | 1,623,346 |
| 6 | Philadelphia | 1,618,963 |
| 7 | San Antonio | 1,448,191 |
| 8 | San Diego | 1,400,047 |
| 9 | Dallas | 1,316,714 |
| 10 | San Jose | 1,022,822 |
| 11 | Austin | 970,951 |
| 12 | Jacksonville | 958,591 |
| 13 | Fort Worth | 927,605 |
| 14 | Columbus | 914,313 |
| 15 | Indianapolis | 896,036 |
| 16 | Charlotte | 882,849 |
| 17 | San Francisco | 882,230 |
| 18 | Seattle | 743,985 |
| 19 | Denver | 722,288 |
| 20 | Washington | 696,066 |
| 21 | Nashville | 695,967 |
| 22 | Oklahoma City | 687,494 |
| 23 | El Paso | 685,234 |
| 24 | Boston | 682,036 |
| 25 | Portland | 658,673 |
| 26 | Las Vegas | 647,973 |
| 27 | Detroit | 645,155 |
| 28 | Memphis | 639,091 |
| 29 | Louisville | 639,031 |
| 30 | Baltimore | 591,247 |
| 31 | Milwaukee | 582,680 |
| 32 | Albuquerque | 569,898 |
| 33 | Tucson | 547,760 |
| 34 | Fresno | 547,233 |
| 35 | Sacramento | 529,907 |
| 36 | Kansas City | 512,895 |
| 37 | Mesa | 509,026 |
| 38 | Atlanta | 503,431 |
| 39 | Omaha | 490,647 |
| 40 | Colorado Springs | 483,490 |
| 41 | Raleigh | 472,087 |
| 42 | Long Beach | 471,156 |
| 43 | Virginia Beach | 463,815 |
| 44 | Miami | 446,423 |
| 45 | Oakland | 444,813 |
| 46 | Minneapolis | 434,020 |
| 47 | Tulsa | 416,972 |
| 48 | Bakersfield | 407,270 |
| 49 | Wichita | 401,291 |
| 50 | Arlington | 397,994 |
| 51 | Aurora | 389,914 |
| 52 | Tampa | 388,599 |
| 53 | New Orleans | 387,628 |
| 54 | Cleveland | 376,148 |
| 55 | Honolulu | 354,283 |
| 56 | Anaheim | 350,104 |
| 57 | San Juan | 345,496 |
| 58 | Lexington | 325,620 |
| 59 | Stockton | 323,838 |
| 60 | Corpus Christi | 320,869 |
| 61 | Henderson | 320,613 |
| 62 | Riverside | 317,977 |
| 63 | Newark | 314,495 |
| 64 | Saint Paul | 314,473 |
| 65 | Santa Ana | 313,161 |
| 66 | Cincinnati | 312,242 |
| 67 | Irvine | 310,579 |
| 68 | Orlando | 310,482 |
| 69 | Pittsburgh | 305,836 |
| 70 | St. Louis | 304,430 |
| 71 | Greensboro | 301,863 |
| 72 | Jersey City | 295,215 |
| 73 | Anchorage | 294,001 |
| 74 | Lincoln | 293,835 |
| 75 | Plano | 288,194 |
| 76 | Durham | 286,187 |
| 77 | Buffalo | 280,981 |
| 78 | Chandler | 278,597 |
| 79 | Chula Vista | 278,092 |
| 80 | Toledo | 273,432 |
| 81 | Madison | 272,392 |
| 82 | Gilbert | 270,452 |
| 83 | Reno | 266,663 |
| 84 | Fort Wayne | 266,381 |
| 85 | North Las Vegas | 265,010 |
| 86 | St. Petersburg | 260,751 |
| 87 | Lubbock | 259,573 |
| 88 | Irving | 259,111 |
| 89 | Laredo | 257,618 |
| 90 | Winston–Salem | 251,905 |
| 91 | Chesapeake | 251,781 |
| 92 | Glendale | 250,673 |
| 93 | Garland | 248,344 |
| 94 | Scottsdale | 243,643 |
| 95 | Norfolk | 240,256 |
| 96 | Boise | 237,913 |
| 97 | Fremont | 232,684 |
| 98 | Spokane | 231,154 |
| 99 | Santa Clarita | 230,835 |
| 100 | Baton Rouge | 229,621 |
| 101 | Richmond | 228,753 |
| 102 | Hialeah | 225,219 |
| 103 | San Bernardino | 224,201 |
| 104 | Tacoma | 221,420 |
| 105 | Modesto | 220,530 |
| 106 | Huntsville | 217,039 |
| 107 | Des Moines | 216,158 |
| 108 | Yonkers | 213,570 |
| 109 | Rochester | 213,326 |
| 110 | Moreno Valley | 210,607 |
| 111 | Fayetteville | 210,473 |
| 112 | Fontana | 210,364 |
| 113 | Columbus | 208,879 |
| 114 | Worcester | 208,471 |
| 115 | Port St. Lucie | 206,788 |
| 116 | Little Rock | 204,507 |
| 117 | Augusta | 203,992 |
| 118 | Oxnard | 203,974 |
| 119 | Birmingham | 202,631 |
| 120 | Montgomery | 202,500 |
| 121 | Frisco | 202,405 |
| 122 | Amarillo | 202,288 |
| 123 | Salt Lake City | 201,612 |
| 124 | Grand Rapids | 200,798 |
| 125 | Huntington Beach | 200,590 |
| 126 | Overland Park | 199,103 |
| 127 | Glendale | 198,402 |
| 128 | Tallahassee | 198,024 |
| 129 | Grand Prairie | 197,954 |
| 130 | McKinney | 197,155 |
| 131 | Cape Coral | 195,851 |
| 132 | Sioux Falls | 194,338 |
| 133 | Peoria | 192,791 |
| 134 | Providence | 192,740 |
| 135 | Vancouver | 192,720 |
| 136 | Knoxville | 192,544 |
| 137 | Akron | 192,270 |
| 138 | Shreveport | 189,367 |
| 139 | Mobile | 188,810 |
| 140 | Brownsville | 188,504 |
| 141 | Newport News | 188,008 |
| 142 | Bayamón | 186,938 |
| 143 | Fort Lauderdale | 184,488 |
| 144 | Chattanooga | 182,812 |
| 145 | Tempe | 182,295 |
| 146 | Aurora | 182,249 |
| 147 | Santa Rosa | 179,811 |
| 148 | Eugene | 178,325 |
| 149 | Elk Grove | 177,790 |
| 150 | Salem | 177,195 |
| 151 | Ontario | 176,922 |
| 152 | Cary | 176,373 |
| 153 | Rancho Cucamonga | 176,103 |
| 154 | Oceanside | 175,714 |
| 155 | Lancaster | 175,157 |
| 156 | Garden Grove | 173,575 |
| 157 | Pembroke Pines | 172,797 |
| 158 | Fort Collins | 171,416 |
| 159 | Palmdale | 171,052 |
| 160 | Springfield | 170,776 |
| 161 | Clarksville | 168,299 |
| 162 | Salinas | 165,089 |
| 163 | Hayward | 164,495 |
| 164 | Paterson | 161,243 |
| 165 | Alexandria | 160,975 |
| 166 | Macon | 158,834 |
| 167 | Corona | 158,622 |
| 168 | Kansas City | 158,088 |
| 169 | Lakewood | 157,459 |
| 170 | Springfield | 157,404 |
| 171 | Sunnyvale | 157,278 |
| 172 | Carolina | 156,279 |
| 173 | Jackson | 155,154 |
| 174 | Killeen | 154,543 |
| 175 | Hollywood | 154,514 |
| 176 | Murfreesboro | 154,214 |
| 177 | Pasadena | 153,387 |
| 178 | Bellevue | 153,290 |
| 179 | Pomona | 153,148 |
| 180 | Escondido | 152,466 |
| 181 | Joliet | 151,784 |
| 182 | Charleston | 151,648 |
| 183 | Mesquite | 151,527 |
| 184 | Naperville | 150,954 |
| 185 | Rockford | 150,061 |
| 186 | Bridgeport | 150,060 |
| 187 | Syracuse | 150,025 |
| 188 | Savannah | 149,177 |
| 189 | Roseville | 149,170 |
| 190 | Torrance | 148,458 |
| 191 | Fullerton | 144,975 |
| 192 | Surprise | 144,502 |
| 193 | McAllen | 143,555 |
| 194 | Thornton | 143,209 |
| 195 | Visalia | 142,721 |
| 196 | Olathe | 142,626 |
| 197 | Gainesville | 142,419 |
| 198 | West Valley City | 141,556 |
| 199 | Orange | 141,234 |
| 200 | Denton | 141,192 |
| 201 | Warren | 140,705 |
| 202 | Pasadena | 140,011 |
| 203 | Waco | 139,796 |
| 204 | Cedar Rapids | 139,012 |
| 205 | Dayton | 138,946 |
| 206 | Ponce | 138,791 |
| 207 | Elizabeth | 138,596 |
| 208 | Hampton | 138,445 |
| 209 | Columbia | 137,924 |
| 210 | Kent | 137,880 |
| 211 | Stamford | 136,751 |
| 212 | Lakewood | 136,436 |
| 213 | Victorville | 136,085 |
| 214 | Miramar | 135,995 |
| 215 | Coral Springs | 135,665 |
| 216 | Sterling Heights | 135,616 |
| 217 | New Haven | 135,290 |
| 218 | Carrollton | 134,696 |
| 219 | Midland | 133,777 |
| 220 | Norman | 129,237 |
| 221 | Santa Clara | 128,854 |
| 222 | Athens | 128,519 |
| 223 | Caguas | 128,447 |
| 224 | Thousand Oaks | 128,167 |
| 225 | Topeka | 127,784 |
| 226 | Simi Valley | 127,551 |
| 227 | Columbia | 127,448 |
| 228 | Vallejo | 127,282 |
| 229 | Fargo | 127,181 |
| 230 | Allentown | 127,035 |
| 231 | Pearland | 127,018 |
| 232 | Concord | 126,596 |
| 233 | Abilene | 126,366 |
| 234 | Arvada | 125,578 |
| 235 | Berkeley | 125,497 |
| 236 | Ann Arbor | 125,022 |
| 237 | Independence | 124,174 |
| 238 | Rochester | 122,543 |
| 239 | Lafayette | 122,522 |
| 240 | Hartford | 122,199 |
| 241 | College Station | 121,651 |
| 242 | Clovis | 121,260 |
| 243 | Fairfield | 121,015 |
| 244 | Palm Bay | 120,893 |
| 245 | Richardson | 120,599 |
| 246 | Round Rock | 120,598 |
| 247 | Cambridge | 119,523 |
| 248 | Meridian | 118,747 |
| 249 | West Palm Beach | 118,525 |
| 250 | Evansville | 118,407 |
| 251 | Clearwater | 118,401 |
| 252 | Billings | 118,224 |
| 253 | West Jordan | 118,067 |
| 254 | Richmond | 117,549 |
| 255 | Westminster | 117,417 |
| 256 | Manchester | 116,738 |
| 257 | Lowell | 116,647 |
| 258 | Wilmington | 116,543 |
| 259 | Antioch | 116,381 |
| 260 | Beaumont | 116,372 |
| 261 | Provo | 116,251 |
| 262 | North Charleston | 115,938 |
| 263 | Elgin | 115,883 |
| 264 | Carlsbad | 115,831 |
| 265 | Odessa | 115,510 |
| 266 | Waterbury | 115,485 |
| 267 | Springfield | 115,476 |
| 268 | League City | 115,474 |
| 269 | Downey | 115,436 |
| 270 | Gresham | 115,327 |
| 271 | High Point | 115,138 |
| 272 | Broken Arrow | 114,614 |
| 273 | Peoria | 114,220 |
| 274 | Lansing | 113,709 |
| 275 | Lakeland | 113,706 |
| 276 | Pompano Beach | 113,106 |
| 277 | Costa Mesa | 112,976 |
| 278 | Pueblo | 112,934 |
| 279 | Lewisville | 112,879 |
| 280 | Miami Gardens | 112,696 |
| 281 | Las Cruces | 112,438 |
| 282 | Sugar Land | 112,076 |
| 283 | Murrieta | 111,998 |
| 284 | Ventura | 111,810 |
| 285 | Everett | 111,675 |
| 286 | Temecula | 111,043 |
| 287 | Dearborn | 111,016 |
| 288 | Santa Maria | 110,744 |
| 289 | West Covina | 110,536 |
| 290 | El Monte | 110,485 |
| 291 | Greeley | 109,824 |
| 292 | Sparks | 109,471 |
| 293 | Centennial | 109,443 |
| 294 | Boulder | 109,274 |
| 295 | Sandy Springs | 109,102 |
| 296 | Inglewood | 108,781 |
| 297 | Edison | 108,605 |
| 298 | South Fulton | 108,452 |
| 299 | Green Bay | 108,411 |
| 300 | Burbank | 108,352 |
| 301 | Renton | 107,795 |
| 302 | Hillsboro | 107,454 |
| 303 | El Cajon | 107,219 |
| 304 | Tyler | 106,997 |
| 305 | Davie | 106,690 |
| 306 | San Mateo | 106,660 |
| 307 | Brockton | 106,642 |
| 308 | Concord | 106,235 |
| 309 | Jurupa Valley | 106,046 |
| 310 | Daly City | 105,893 |
| 311 | Allen | 105,616 |
| 312 | Rio Rancho | 105,030 |
| 313 | Rialto | 105,010 |
| 314 | Woodbridge | 104,619 |
| 315 | South Bend | 104,431 |
| 316 | Spokane Valley | 103,950 |
| 317 | Norwalk | 103,745 |
| 318 | Menifee | 103,497 |
| 319 | Vacaville | 103,354 |
| 320 | Wichita Falls | 103,284 |
| 321 | Davenport | 102,686 |
| 322 | Quincy | 102,597 |
| 323 | Chico | 102,435 |
| 324 | Lynn | 102,210 |
| 325 | Lee's Summit | 102,064 |
| 326 | New Bedford | 102,035 |
| 327 | Federal Way | 101,985 |
| 328 | Clinton | 101,463 |
| 329 | Edinburg | 101,191 |
| 330 | Nampa | 101,148 |
| 331 | Roanoke | 100,957 |
Q - Does Prarang do surveys to collect data? How does Prarang have such granular
Country-level details which no private or public data source offers?
A - Prarang does not conduct surveys to gather data; instead, we rely on publicly available
sources such as UN Population data, the CIA World Factbook, and private surveys whose results
are accessible through news media and public websites. Our data classification follows a
three-fold method rooted in Indian logic (Tarkashastra): Pramana (evidence-based data
collection) involves gathering data from credible sources; Anumana (estimation and inference)
uses modeling to draw inferences from the collected data; and Upamana (comparison) ranks
countries through relative comparison, calculating the Samana (country average) to determine
whether each country ranks above or below this benchmark. All data sources and estimation
modeling methods are transparently detailed and accessible, with information available for each
data field by clicking the "i" icon.
A - Prarang does not do any surveys. It does data modeling & estimations based on third-party census & surveys, already in the public domain. It also shares the source of the data it uses. Users need to make their own judgment of how and for what purpose and when they use the data that they download from this Prarang website.