Analytics: India
Analytics: India
Date: May 25, 2026
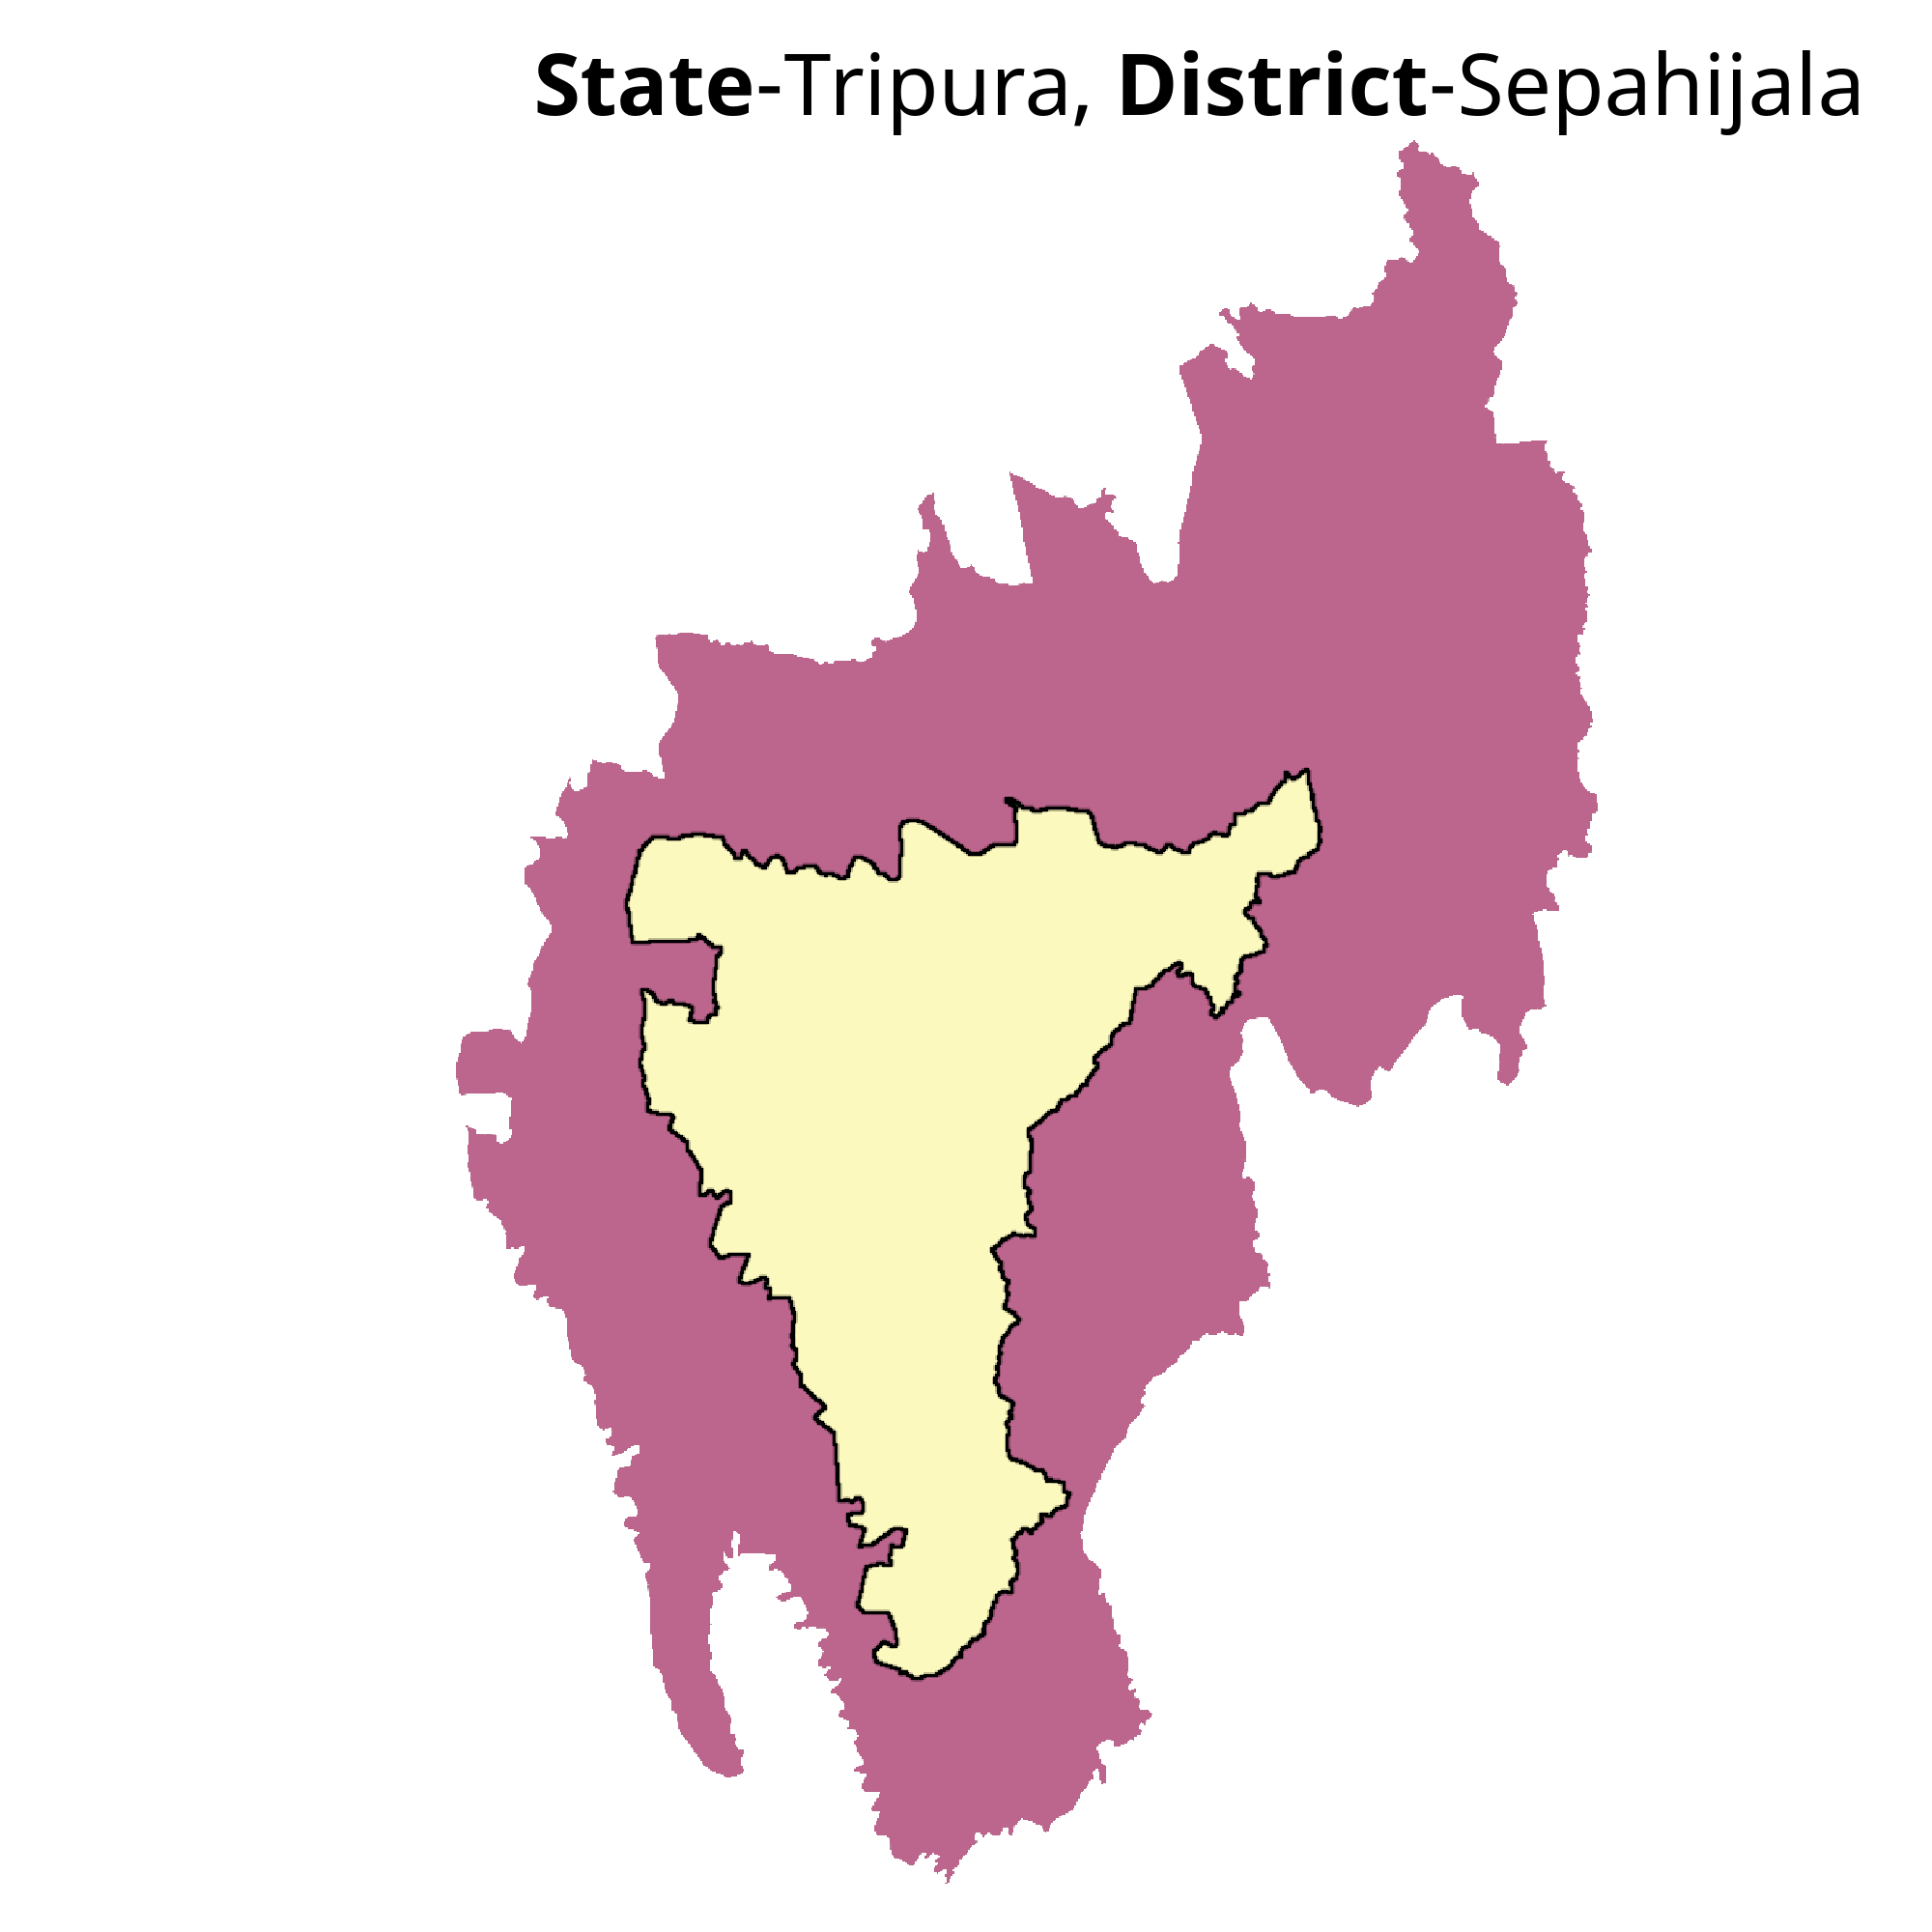
Bishramganj city is the capital of Sepahijala district, which has 16.4% of the State's population.
Bishramganj is the 646th ranked city in population, out of 756 District Capitals (DHQs) of India. It is the capital of Sepahijala District in Tripura State. Sepahijala District is ranked 560th in population and 695th in area across India.
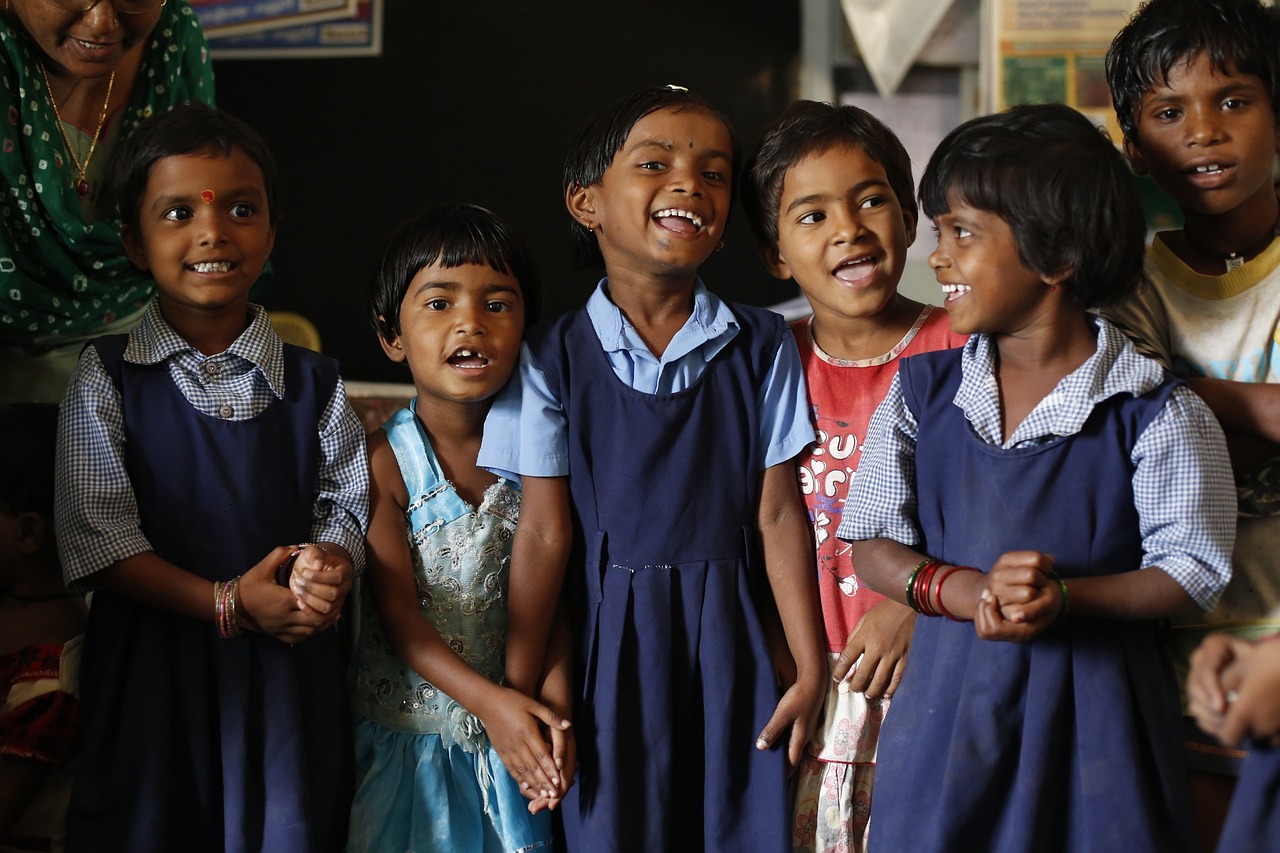
Out of 756 District Capitals/Districts of India, Bishramganj is the 38th highest ranked in Literacy (%, Census 2023)Estd . This indicates a good ratio of educational institute to population.
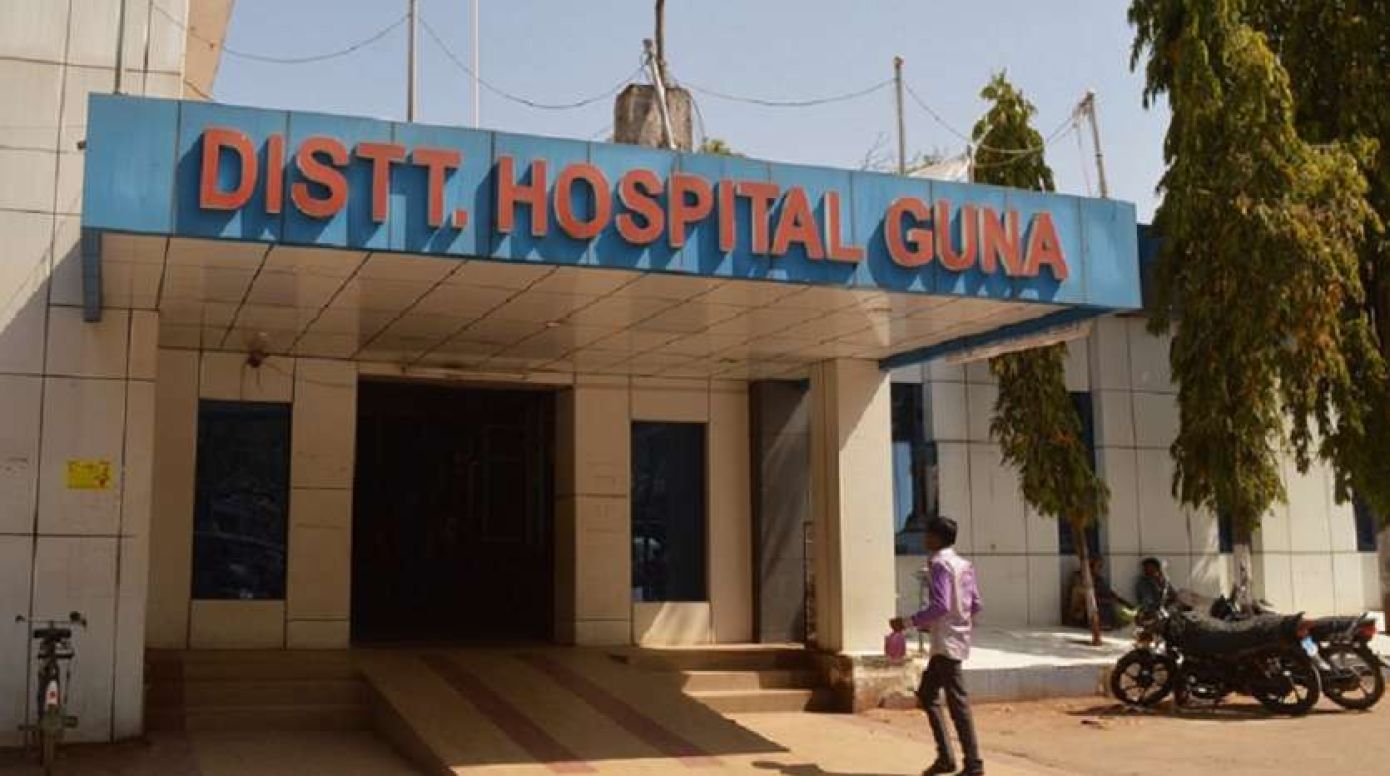
Out of 756 District Capitals/Districts of India, Bishramganj is the 155th highest ranked in No of District Hospital . This indicates that health infrastructure in this district is better than other districts.
Out of 756 District Capitals/Districts of India, Bishramganj is the 310th highest ranked in Sex-Ratio (1000) (%, Census 2011) . This indicates a healthy ratio between men and women.
The average Number of Missing Persons (NO, IPC 2023) of Indian city (district capitals)/districts is 660. Bishramganj is the 751st highest ranked city out of 756 city/districts.This indicates a safer district as compared to other districts.
 Literacy (%, Census 2023)Estd
 No of District Hospital
 Sex-Ratio (1000) (%, Census 2011)
 Number of Missing Persons (NO, IPC 2023)
 Murder/Lakh Pop (Ratio, IPC 2023)
 # of Population (0-18) (No, Census 2011)
 No of Hospital Beds
 Population per sq. km. (Km, Census 2011)
Out of 756 District Capitals/Districts of India, Bishramganj is the 159th worst ranked in Murder/Lakh Pop (Ratio, IPC 2023) . This implies lesser effectiveness of law and order in this district compared to other districts.
Out of 756 District Capitals/Districts of India, Bishramganj is the 709th worst ranked in # of Population (0-18) (No, Census 2011) . This indicates that this district has a lower birth rate.
The Average No of Hospital Beds of Indian City (District Capitals)/Districts is 1289. Bishramganj is the 621st worst ranked City out of 756 City/Districts. This indicates that health infrastructure in this district is poor than in other districts.
The Average Population per sq. km. (Km, Census 2011) of Indian City (District Capitals)/Districts is 589. Bishramganj is the 544th worst ranked City out of 756 City/Districts. This implies that this district has a lower birth rate and/or lower attractiveness for migrants.
The Data-Ranks below are numbered from 1 to 756 for each metric. The Indian census data is aggregated and shared for 756 geographies by the government at a regular frequency. We have shared the data-rank below for easy relative comparison between the 756 Indian districts/state captials. However, we do have the actual numbers for each metric, and these are available for our registered users. To register, please click here.
Bishramganj Nature Highlights
| Nature Metrics | % of India | Rank Out of 756 | City / Districts Data | |
|---|---|---|---|---|
|
Number of Donkey (20th Cattle Census) |
Number of Donkey (20th Cattle Census) | 0.01% | 13th | 9348 |
|
Number of Total Poultry (20th Cattle Census) |
Number of Total Poultry (20th Cattle Census) | 0.12% | 57th | 10923 |
|
Number of Goat (20th Cattle Census) |
Number of Goat (20th Cattle Census) | 0.04% | 155th | 10453 |
|
Number of Sheep (20th Cattle Census) |
Number of Sheep (20th Cattle Census) | 0.00% | 178th | 3215 |
|
Number of Pony (20th Cattle Census) |
Number of Pony (20th Cattle Census) | 0.01% | 245th | 8018 |
|
Number of Pig (20th Cattle Census) |
Number of Pig (20th Cattle Census) | 0.33% | 340th | 6447 |
|
Number of Horse (20th Cattle Census) |
Number of Horse (20th Cattle Census) | 0.00% | 345th | 5830 |
|
Number of Buffalo (20th Cattle Census) |
Number of Buffalo (20th Cattle Census) | 0.00% | 386th | 6517 |
|
Number of Cattle (20th Cattle Census) |
Number of Cattle (20th Cattle Census) | 0.08% | 540th | 5856 |
The Data-Ranks below are numbered from 1 to 756 for each metric. The Indian census data is aggregated and shared for 756 geographies by the government at a regular frequency. We have shared the data-rank below for easy relative comparison between the 756 Indian districts/state captials. However, we do have the actual numbers for each metric, and these are available for our registered users. To register, please click here.
Bishramganj Culture message.info.Highlights
| Sr.No | ai.info.Culture Metrics | ai.info.Counts | ai.info.Name |
|---|
The Data-Ranks below are numbered from 1 to 756 for each metric. The Indian census data is aggregated and shared for 756 geographies by the government at a regular frequency. We have shared the data-rank below for easy relative comparison between the 756 Indian districts/state captials. However, we do have the actual numbers for each metric, and these are available for our registered users. To register, please click here.
Better than India Average
| Sr.No | Fields | India Average | Rank out of 756 | City / District Data |
|---|---|---|---|---|
| 1 | No of District Hospital | 1 | 155th | 7255 |
| 2 | No of Sub Divisional Hospital | 2 | 192nd | 2839 |
Worse than India Average
| Sr.No | Fields | India Average | Worst Rank out of 756 | City / District Data |
|---|---|---|---|---|
| 1 | No of Nurses | 3442 | 69th | 7888 |
| 2 | No of Primary Health Centers | 49 | 128th | 5890 |
| 3 | No of Total Hospitals | 62 | 212th | 5211 |
| 4 | No of Doctors | 1825 | 420th | 7698 |
| 5 | No of Hospital Beds | 1289 | 621st | 10098 |
The Data-Ranks below are numbered from 1 to 756 for each metric. The Indian census data is aggregated and shared for 756 geographies by the government at a regular frequency. We have shared the data-rank below for easy relative comparison between the 756 Indian districts/state captials. However, we do have the actual numbers for each metric, and these are available for our registered users. To register, please click here.
Worse than India Average
| Sr.No | Fields | India Average | Worst Rank out of 756 | City / District Data |
|---|---|---|---|---|
| 1 | Bank Deposits (Crore, RBI SCB Q1 2025) | 31874 | 98th | 5980 |
| 2 | Bank Credit (Crore, RBI SCB Q1 2025) | 25201 | 109th | 7251 |
| 3 | GDP (Crores. RBI SCB 2023) | 28231 | 124th | 1212 |
| 4 | Number of Banks (No, RBI SCB Q1 2025) | 196 | 146th | 8346 |
| 5 | GDP per Capita ('000', RBI SCB 2023) | 119 | 225th | 2728 |
| 6 | Bank Deposit-Bank Loans (Crores, RBI SCB 2025) | 6237 | 260th | 9078 |
| 7 | Bank Credit - Bank Debit/No. of banks (Crore, RBI SCB 2025) | 23 | 261st | 10243 |
The Data-Ranks below are numbered from 1 to 756 for each metric. The Indian census data is aggregated and shared for 756 geographies by the government at a regular frequency. We have shared the data-rank below for easy relative comparison between the 756 Indian districts/state captials. However, we do have the actual numbers for each metric, and these are available for our registered users. To register, please click here.
Better than India Average
| Sr.No | Fields | India Average | Rank out of 756 | City / District Data |
|---|---|---|---|---|
| 1 | Sex-Ratio (1000) (%, Census 2011) | 950 | 310th | 8018 |
| 2 | Dist. Formation Year | 2011 | 96th | 5140 |
Worse than India Average
| Sr.No | Fields | India Average | Worst Rank out of 756 | City / District Data |
|---|---|---|---|---|
| 1 | Decadal Growth Rate (2011) (%, Census 2011) | 19 | 212th | 2361 |
| 2 | Population per sq. km. (Km, Census 2011) | 589 | 544th | 2623 |
The Data-Ranks below are numbered from 1 to 756 for each metric. The Indian census data is aggregated and shared for 756 geographies by the government at a regular frequency. We have shared the data-rank below for easy relative comparison between the 756 Indian districts/state captials. However, we do have the actual numbers for each metric, and these are available for our registered users. To register, please click here.
Worse than India Average
| Sr.No | Fields | India Average | Worst Rank out of 756 | City / District Data |
|---|---|---|---|---|
| 1 | # of Diploma (No, AISHE 2021) | 3736 | 7th | 6678 |
| 2 | # of Colleges (No, AISHE 2021) | 58 | 17th | 9357 |
| 3 | # of Higher Education Enrolments % of Pop (No, UDISE 2023) | 2 | 35th | 2928 |
| 4 | # of Ph.D Enrolments (No, AISHE 2021) | 275 | 43rd | 3207 |
| 5 | # of UG Enrolments - Law (No, AISHE 2021) | 613 | 67th | 2111 |
| 6 | Population (18-24) (Number, 2023) | 222087 | 80th | 3172 |
| 7 | # of PG Enrolments - Engg (No, AISHE 2021) | 205 | 87th | 4121 |
| 8 | # of ITIS seats (No, AISHE 2021) | 4405 | 111th | 4861 |
| 9 | Gross Enrolment Ratio (GER) in Higher Education (18-23 Years) (No, AISHE 2021) | 29 | 153rd | 3322 |
| 10 | # of Enrolment in Private and Government Colleges (No, AISHE 2021) | 40299 | 176th | 3013 |
| 11 | # of UG Enrolments - Teaching (No, AISHE 2021) | 1969 | 188th | 2515 |
| 12 | # of Total Enrolments (No, AISHE 2021) | 50309 | 197th | 7987 |
| 13 | # of Bachelor's Enrolment (No, AISHE 2021) | 45972 | 206th | 8181 |
| 14 | # of UG Enrolments - Engg (No, AISHE 2021) | 3524 | 233rd | 9882 |
| 15 | # of Master's Enrolment (No, AISHE 2021) | 6932 | 277th | 10379 |
| 16 | # of UG Enrolments - Medical (No, AISHE 2021) | 459 | 480th | 3849 |
| 17 | # of UG Diploma Enrolments (No, AISHE 2021) | 342 | 524th | 6945 |
| 18 | # of No. of Schools (No, UDISE 2023) | 1950 | 666th | 10672 |
| 19 | # of Population (0-18) (No, Census 2011) | 139111 | 709th | 7801 |
The Data-Ranks below are numbered from 1 to 756 for each metric. The Indian census data is aggregated and shared for 756 geographies by the government at a regular frequency. We have shared the data-rank below for easy relative comparison between the 756 Indian districts/state captials. However, we do have the actual numbers for each metric, and these are available for our registered users. To register, please click here.
Better than India Average
| Sr.No | Fields | India Average | Rank out of 756 | City / District Data |
|---|---|---|---|---|
| 1 | Sanctioned Police Force Number (NO, IPC 2023) | 3647 | 321st | 8268 |
| 2 | Murder/Lakh Pop (Ratio, IPC 2023) | 2 | 159th | 4166 |
Worse than India Average
| Sr.No | Fields | India Average | Worst Rank out of 756 | City / District Data |
|---|---|---|---|---|
| 1 | Number of Police Stations (NO, IPC 2023) | 24 | 86th | 7605 |
| 2 | Crime/1000 Pop (Ratio, IPC 2023) | 2 | 76th | 9610 |
| 3 | Number of Murders (NO, IPC 2023) | 35 | 98th | 3337 |
| 4 | Number of Cyber Crimes (NO, IPC 2023) | 168 | 127th | 1815 |
| 5 | Number of IPC Crimes (NO, IPC 2023) | 4510 | 523rd | 1294 |
| 6 | Number of Missing Persons (NO, IPC 2023) | 660 | 751st | 2857 |
The Data-Ranks below are numbered from 1 to 756 for each metric. The Indian census data is aggregated and shared for 756 geographies by the government at a regular frequency. We have shared the data-rank below for easy relative comparison between the 756 Indian districts/state captials. However, we do have the actual numbers for each metric, and these are available for our registered users. To register, please click here.
Worse than India Average
| Sr.No | Fields | India Average | Worst Rank out of 756 | City / District Data |
|---|---|---|---|---|
| 1 | Urban Internet Pop/City Pop(%, TRAI December 2025) | 268 | 308th | 4387 |
| 2 | Number of Internet Connections (No, TRAI December 2025) | 441661 | 382nd | 8505 |
| 3 | English Speakers (Second Language + Third Language (No, Census 2011) | 165561 | 493rd | 5596 |
The Data-Ranks below are numbered from 1 to 756 for each metric. The Indian census data is aggregated and shared for 756 geographies by the government at a regular frequency. We have shared the data-rank below for easy relative comparison between the 756 Indian districts/state captials. However, we do have the actual numbers for each metric, and these are available for our registered users. To register, please click here.
Better than India Average
| Sr.No | Fields | India Average | Rank out of 756 | City / District Data |
|---|---|---|---|---|
| 1 | Literacy (%, Census 2023)Estd | 78 | 38th | 10490 |
Worse than India Average
| Sr.No | Fields | India Average | Worst Rank out of 756 | City / District Data |
|---|---|---|---|---|
| 1 | Perso-Arabic Script (Urdu) | 28193 | 129th | 10573 |
| 2 | Odia Script | 5834 | 152nd | 4157 |
| 3 | Devnagri Script (Hindi) | 141581 | 212th | 5591 |
| 4 | Kannada Script | 16891 | 223rd | 6229 |
| 5 | DHQ Mother Tongue Population (No, Census 2011) | 262810 | 264th | 3329 |
| 6 | Bengali Script | 21988 | 279th | 10117 |
| 7 | Latin Script (English) | 2269 | 288th | 9130 |
| 8 | English Multilingual Population | 50989 | 300th | 2798 |
| 9 | Assamese Script | 4293 | 398th | 9398 |
| 10 | Marathi Script | 29990 | 553rd | 6906 |
The Data-Ranks below are numbered from 1 to 756 for each metric. The Indian census data is aggregated and shared for 756 geographies by the government at a regular frequency. We have shared the data-rank below for easy relative comparison between the 756 Indian districts/state captials. However, we do have the actual numbers for each metric, and these are available for our registered users. To register, please click here.
Worse than India Average
| Sr.No | Fields | India Average | Worst Rank out of 756 | City / District Data |
|---|---|---|---|---|
| 1 | Number of Dailies or Magazines (No, RNI 2022) | 245 | 122nd | 3272 |
| 2 | Total Annual Newspaper Circulation (No, RNI 2022) | 670794 | 153rd | 9339 |
The Data-Ranks below are numbered from 1 to 756 for each metric. The Indian census data is aggregated and shared for 756 geographies by the government at a regular frequency. We have shared the data-rank below for easy relative comparison between the 756 Indian districts/state captials. However, we do have the actual numbers for each metric, and these are available for our registered users. To register, please click here.
The Data-Ranks below are numbered from 1 to 756 for each metric. The Indian census data is aggregated and shared for 756 geographies by the government at a regular frequency. We have shared the data-rank below for easy relative comparison between the 756 Indian districts/state captials. However, we do have the actual numbers for each metric, and these are available for our registered users. To register, please click here.
Worse than India Average
| Sr.No | Fields | India Average | Worst Rank out of 756 | City / District Data |
|---|---|---|---|---|
| 1 | # of Companies,2023 | 1934 | 59th | 10265 |
| 2 | Informal Jobs(Dist.),2023 | 636719 | 144th | 11016 |
| 3 | Informal Jobs(DHQ),2023 | 57714 | 169th | 3904 |
| 4 | Formal Jobs(DHQ),2023 | 37722 | 192nd | 5790 |
| 5 | State Govt Jobs(Formal) DHQ,2023 | 14287 | 196th | 6692 |
| 6 | Formal Jobs(Dist.),2023 | 25445 | 379th | 9331 |
| 7 | State Govt Jobs(Formal) Dist.,2023 | 23727 | 381st | 8168 |
LANGUAGES
City (District Capitals)/DHQ
Number Of Languages spoken by more then 30K Population : 0
BASIC DETAILS
| City (District Capitals)/DHQ
Population : |
: | 21,085 |
|---|---|---|
| City (District Capitals)/DHQ Population (Rank) |
: | 646th |
| District Area (km2) |
: | 1,045 |
| District Area (Rank) |
: | 695th |
| No.of Towns
in District |
: | 0 |
| No. of Villages
in District |
: | 0 |
Q - Why is all Prarang India comparative analysis being done for 756 Districts & their
respective
D.H.Q. (District Head Quarter) towns?
A - The Indian geography has historically been measured by " Districts". Today, it is
politically
managed by States & U.T.s ( Union Territories) but the unit of measurement ( Census
baseline)
continues to focus on the District, for over 150 years now. " All India" thus is a sum of the
district
parts i.e. sum of 756 districts currently ( which were 640 districts only, when the last Census
took
place in 2011). Contrary to popular perception, most data being reported at a State & U.T.
level, is
not being aggregated from underlying data at an urban (towns) & rural(villages) level. India
has
approx. 9000 towns & 600000 villages, segregated into 756 districts, each with its
respective
DHQ
(District Head Quarter) town. Except for the largest 20 towns ( Metropolitan agglomerations)
where
some detailed data is gathered by the Central Government census, only basic demographic details
are available for India's cities. Detailed survey results of the District are the most important
data
points, used to model & estimate the City & State level information in India. The 756
DHQ (
District
Head Quarter) towns & 8 Union Territories, are the important Urban metrics available in
India,
for
comparative analysis. Big data of a big & diverse country.