Chandigarh AI Report
Chandigarh accounts for 0.08% of India's population,
ranking 4th among all 8 UTs. Its contribution to India's
GDP is 0.66%.
in India’s GDP. It has 1 District Capitals,
are
Chandigarh
.
It contributes to India's production of 0.01% of Potatoes, 0.02% of Banana, and 0.02% of Onion. Famous historical and cultural landmarks of this region include Forts such as Burail Fort in Chandigarh, Historic churches such as Cathedral of St. Michael and St. Joseph in Shimla of the Diocese of Simla and Chandigarh in Chandigarh, Museums such as Government Museum and Art Gallery in Chandigarh.
It contributes to India's production of 0.01% of Potatoes, 0.02% of Banana, and 0.02% of Onion. Famous historical and cultural landmarks of this region include Forts such as Burail Fort in Chandigarh, Historic churches such as Cathedral of St. Michael and St. Joseph in Shimla of the Diocese of Simla and Chandigarh in Chandigarh, Museums such as Government Museum and Art Gallery in Chandigarh.

Chandigarh ranks at 1st
in Linkedin Audience Size (No, Linkedin December 2025)
out of all 8 Union Territories. This indicates higher Linkedin IDs in Linkedin Advertising module for this town vis a vis other towns.
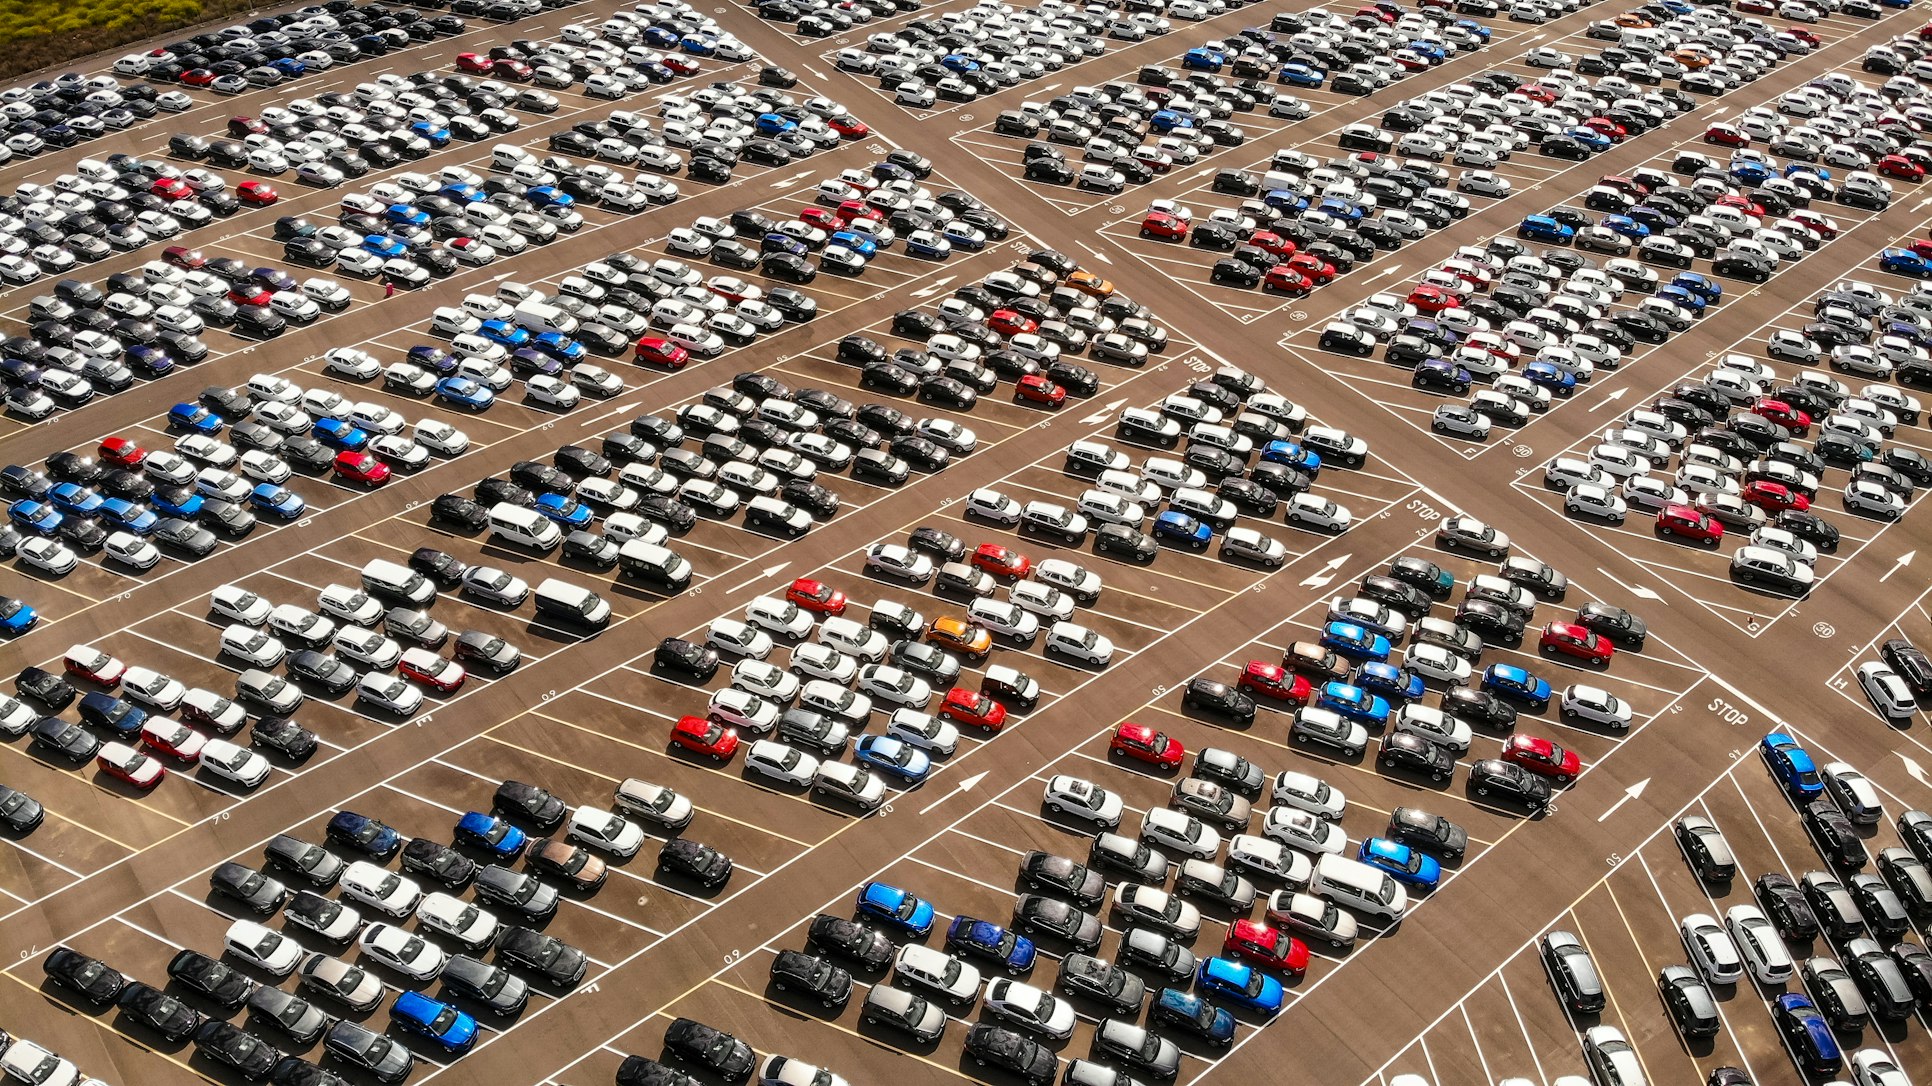
Out of the all the Union Territories, Chandigarh holds a top rank of 1st
in % of Households with Cars (%, Census 2011)
. This implies that standard of living of people in this state/UT is better compared to other state/UTs.
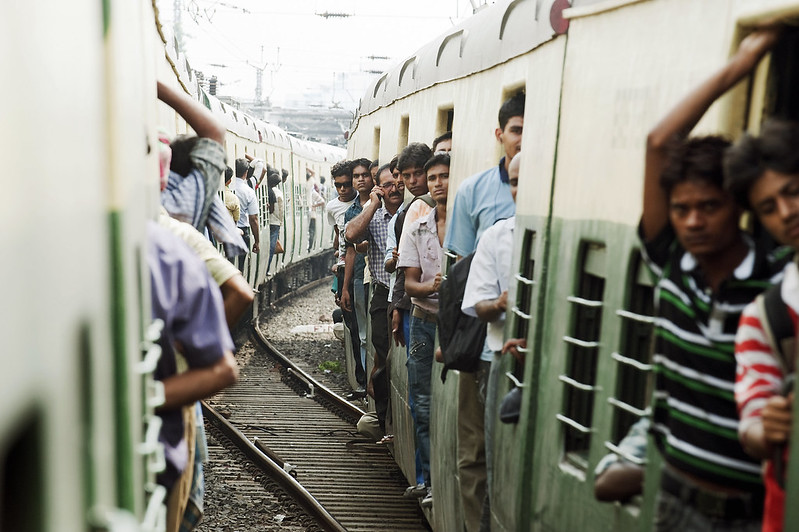
Chandigarh ranks at 2nd
in Population per sq. km. (Km, Census 2011)
out of all 8 Union Territories. This implies more available land per person, and offers environmental and spatial advantages compared to other states/UTs.
Among the Union Territories, Chandigarh stands rather low at 1st
rank in Crime/1000 Pop (Ratio, NCRB 2022)
. This implies lesser effectiveness of law and order in this state/UT compared to other state/UTs.

Linkedin Audience Size (No, Linkedin December 2025)

% of Households with Cars (%, Census 2011)

Population per sq. km. (Km, Census 2011)

Crime/1000 Pop (Ratio, NCRB 2022)
