Analytics: World
Analytics: World
Date: June 23, 2026
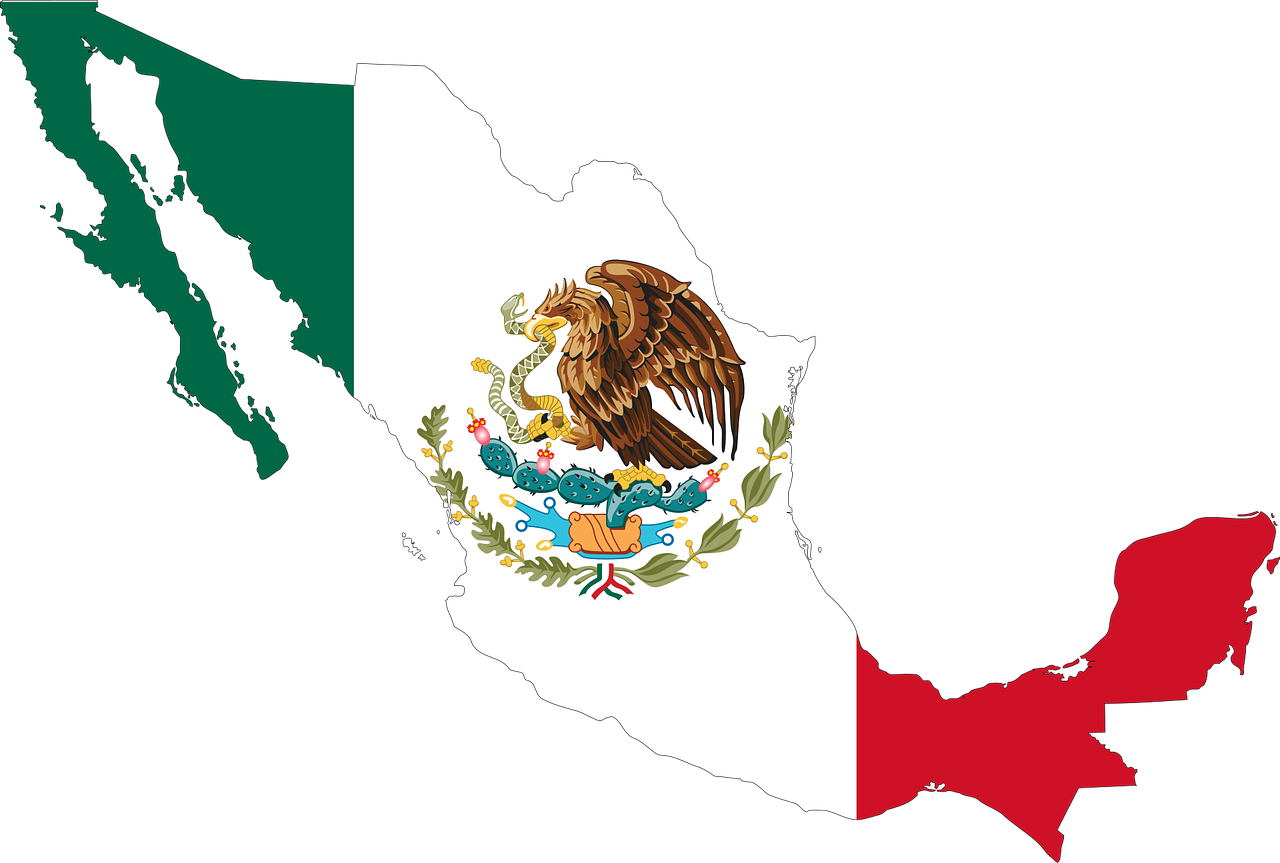
 Mexico is a large country with 1.6% of the world's population. Mexico is a democratic country. It has 35 world heritage sites. It is home to 5.1% Christians of the world. It produces 1.4% Onions of the world. It is rich in resources and has 2.3% Oil, 17.6% Fluorite, 3.8% Bismuth, 5.1% Copper, 6.1% Mercury, 29.4% Silver, and 6.9% Zinc of the world.
Mexico is the 11th ranked country in population and 13th ranked in area out of 195 countries in the world. Please keep the country rank in perspective, for the highlights below.
 Silver prod.
 Flourite prod.
 Facebook users
 Teachers in primary edu.
Out of 195 countries in the world, Mexico is the 1st highest ranked in Silver prod. . This implies that the country has higher foreign earnings through Silver exports or indicate higher economic growth potential.
Out of 195 countries in the world, Mexico is the 2nd highest ranked in Flourite prod. . This implies that the country has a robust aluminium/steel/ceramics industry or may be a huge exporter of Flourite.
The Average Facebook users of 195 countries in the world is 11,706,915. Mexico is the 6th highest ranked country out of 195 countries. This may take into context a higher country population, or may simply imply that this country has more social media popularity, or may have a higher youth demographic.
The Average Teachers in primary edu. of 195 countries in the world is 112,672. Mexico is the 6th highest ranked country out of 195 countries. This implies better investment by the country in primary education when compared to other countries.
 GDP Per Capita (USD)
 Rice prod.
 Sweet Potatoes prod.
The Average GDP Per Capita (USD) of 195 countries in the world is 18,044. Mexico is the 122nd worst ranked country out of 195 countries. This implies that this country is a developing country.
Mexico is the 137th worst ranked in Rice prod. out of all the 195 countries.This is indicative of less focus on the production of rice, or scarcity of fertile land, or higher industrialisation as compared to other countries.
The Average Sweet Potatoes prod. of 195 countries in the world is 878,129. Mexico is the 148th worst ranked country out of 195 countries. This is indicative of less focus on the production of sweet potatoes, or scarcity of fertile land, or higher industrialisation as compared to other countries.
The Average Total No. of Pharmacists of 195 countries in the world is 19,528. Mexico is the 148th worst ranked country out of 195 countries. This may indicate worse healthcare infrastructure investment by the country or may indicate lower population
| Sr. | Title | Metric | World Average | Rank out of 195 | Value | ||
|---|---|---|---|---|---|---|---|
|
Above World Average |
|||||||
| 1 | Spanish | # People | 16,324,341 | 1 | 1126 | ||
| 2 | Spanish as a % of total Spanish speakers | % People | 0 | 1 | 1125 | ||
|
Below World Average |
|||||||
| 1 | Standard Chinese | # People | 26,081,662 | 28 | 1234 | ||
| Sr. | Title | Metric | World Average | Rank out of 195 | Value | ||
|---|---|---|---|---|---|---|---|
|
Above World Average |
|||||||
| 1 | Pop. with access to Electricity (%) | % People | 86 | 1 | 1127 | ||
| 2 | # Cities>500000 | # Cities | 7 | 5 | 1127 | ||
| 3 | # Cities>500000 | # Cities | 4 | 5 | 1130 | ||
| 4 | # Cities>300000 | # Cities | 11 | 7 | 1128 | ||
| 5 | # Cities>300000 | # Cities | 7 | 7 | 1126 | ||
| 6 | # Cities>100000 | # Cities | 27 | 8 | 1127 | ||
| 7 | # Cities>100000 | # Cities | 21 | 8 | 1127 | ||
| 8 | # Cities>1M | # Cities | 1 | 8 | 1130 | ||
| 9 | Urban Population (2021) | # People | 23,603,754 | 9 | 1128 | ||
| 10 | # Cities>1M | # Cities | 4 | 9 | 1129 | ||
| 11 | # Cities>5M | # Cities | 0 | 9 | 1128 | ||
| 12 | Rural Pop. | # People | 18,013,759 | 23 | 1129 | ||
| 13 | Urban Population / Total Population % . | % People | 60 | 43 | 1127 | ||
|
Below World Average |
|||||||
| 1 | Rural Pop. /Total Pop. % | % People | 40 | 153 | 1234 | ||
| 2 | # Cities>5M | # Cities | 1 | 11 | 1234 | ||
| Sr. | Title | Metric | World Average | Rank out of 195 | Value | ||
|---|---|---|---|---|---|---|---|
|
Above World Average |
|||||||
| 1 | Silver prod. | Tons | 1,980 | 1 | 1126 | ||
| 2 | Silver Produced/Total Silver Produced % | Weight | 9 | 1 | 1129 | ||
| 3 | Flourite prod. | Tons | 231,501 | 2 | 1126 | ||
| 4 | Flourite Produced/Total Flourite Produced % | Weight | 4 | 2 | 1127 | ||
| 5 | Orange Production (in tonnes) | Weight | 618,959 | 3 | 1126 | ||
| 6 | Orange Production (% of Total Orange Production) | Percent | 0 | 3 | 1128 | ||
| 7 | Cow Beef Production (in tonnes) | Weight | 320,761 | 5 | 1127 | ||
| 8 | Cow Beef Production (% of Total Cow Beef Production) | Percent | 0 | 5 | 1129 | ||
| 9 | Sugarcane prod. | Tons | 20,929,075 | 6 | 1125 | ||
| 10 | Sugarcane Produced/Total Sugarcane Produced.% | Weight | 2 | 6 | 1126 | ||
| 11 | Chicken Meat Production (in tonnes) | Weight | 588,164 | 6 | 1129 | ||
| 12 | Chicken Meat Production (% of Total Chicken Meat Production) | Percent | 0 | 6 | 1125 | ||
| 13 | Honey prod. | Tons | 15,393 | 8 | 1128 | ||
| 14 | Honey Produced /Total Honey Produced % | Weight | 0 | 8 | 1128 | ||
| 15 | Number of Cows | Count | 8,697,624 | 10 | 1128 | ||
| 16 | Cows (% of Total Cows) | Percent | 0 | 10 | 1127 | ||
| 17 | Oil Prod. | Barrels/day | 855,887 | 11 | 1128 | ||
| 18 | Forest Area. | Area | 21,595,147 | 12 | 1130 | ||
| 19 | Country forest area / Global Forest area % | 0 | 12 | 1125 | |||
| 20 | Cow Milk Production (in tonnes) | Weight | 3,855,383 | 13 | 1128 | ||
| 21 | Cow Milk Production (% of Total Cow Milk Production) | Percent | 0 | 13 | 1129 | ||
| 22 | Onion prod. | Tons | 819,042 | 15 | 1129 | ||
| 23 | Onion Produced/Total Onion Produced % | Weight | 0 | 15 | 1127 | ||
| 24 | Number of Trees | Count | 15,642,617,148 | 44 | 1130 | ||
| 25 | Tree density. | Density | 22,685 | 74 | 1127 | ||
|
Below World Average |
|||||||
| 1 | Copper Produced /Total Copper Produced % | Weight | 9 | 8 | 1232 | ||
| 2 | Bismuth Produced/Total Bismuth Produced % | Weight | 14 | 3 | 1235 | ||
| 3 | Mercury Produced/Total Mercury Produced % | Weight | 14 | 2 | 1230 | ||
| 4 | Zinc Produced/Total Zinc Produced %. | Weight | 9 | 5 | 1234 | ||
| 5 | Gold Produced/Total Gold Produced %. | 4 | 6 | 1235 | |||
| 6 | Natural Gas Produced/Total Natural Gas Produced % | Mass | 5 | 24 | 1231 | ||
| 7 | Oil Prodcuced/Total Oil Produced % | 5 | 11 | 1234 | |||
| 8 | Rice Produced/Total Rice Produced.% | Weight | 0 | 59 | 1235 | ||
| 9 | Tree density . | Density | 828 | 60 | 1232 | ||
| 10 | Rice prod. | Tons | 6,920,442 | 59 | 1235 | ||
| 11 | Sweet Potatoes Produced/Total Sweet Potatoes Produced % | Weight | 0 | 48 | 1233 | ||
| 12 | Sweet Potatoes prod. | Tons | 878,129 | 48 | 1235 | ||
| 13 | Soyabean Produced/Total Soyabean Produced % | Weight | 1 | 30 | 1231 | ||
| 14 | Potatoes prod. | Tons | 2,504,846 | 31 | 1230 | ||
| 15 | Soyabean prod. | Tons | 3,572,369 | 31 | 1234 | ||
| 16 | Potatoes Produced /Total Potatoes Produced % | Weight | 0 | 30 | 1234 | ||
| 17 | Wheat prod. | Tons | 6,811,171 | 30 | 1235 | ||
| 18 | Wheat Produced /Total Wheat Produced. %. | Weight | 0 | 30 | 1230 | ||
| 19 | Coal Production (in 1000 metric tons) | Weight | 121,850 | 30 | 1231 | ||
| 20 | Coal Production (% of Total Coal Production) | Percent | 1 | 30 | 1232 | ||
| 21 | Barley prod. | Tons | 1,545,003 | 28 | 1231 | ||
| 22 | Barley Produced/Total Barley Produced.% | Weight | 1 | 28 | 1235 | ||
| 23 | Natural Gas Prod. | Million cubic meters | 43,738 | 24 | 1234 | ||
| 24 | Goat Milk Production (in tonnes) | Weight | 196,989 | 24 | 1230 | ||
| 25 | Goat Milk Production (% of Total Goat Milk Production) | Percent | 0 | 24 | 1235 | ||
| 26 | Apple Production (% of Total Apple Production) | Percent | 1 | 19 | 1234 | ||
| 27 | Goat Meat Production (in tonnes) | Weight | 46,111 | 19 | 1233 | ||
| 28 | Apple Production (in tonnes) | Weight | 1,044,287 | 19 | 1232 | ||
| 29 | Goat Meat Production (% of Total Goat Meat Production) | Percent | 0 | 19 | 1234 | ||
| 30 | Iron Production (in 1000 metric tons) | Weight | 33,258 | 17 | 1234 | ||
| 31 | Iron Production (% of Total Iron Production) | Percent | 2 | 17 | 1234 | ||
| 32 | Cotton Production (in 1000 480 lb. Bales) | Weight | 1,707 | 15 | 1230 | ||
| 33 | Cotton Production (% of Total Cotton Production) | Percent | 1 | 15 | 1231 | ||
| 34 | Copper prod. | Tons | 1,350 | 8 | 1234 | ||
| 35 | Gold Prod. | Weight | 125 | 6 | 1230 | ||
| 36 | Zinc prod. | Tons | 1,007,000 | 5 | 1234 | ||
| 37 | Bismuth prod. | Tons | 2,019 | 3 | 1232 | ||
| Sr. | Title | Metric | World Average | Rank out of 195 | Value | ||
|---|---|---|---|---|---|---|---|
|
Above World Average |
|||||||
| 1 | Import Ban(Number of products) | Count | 12 | 2 | 1130 | ||
| 2 | FDI / Total FDI of the World %. | 0 | 11 | 1127 | |||
| 3 | FDI (millions USD) | Amount | 3,288 | 12 | 1125 | ||
| 4 | GDP as a % of Total GDP | Percent | 0 | 12 | 1126 | ||
| 5 | Import of Goods and Services (in Million $) | Amount | 173,515 | 13 | 1125 | ||
| 6 | Imports/Total Imports of the World %. | 0 | 13 | 1130 | |||
| 7 | Exports /Total Exports of the World %. | 0 | 14 | 1125 | |||
| 8 | GDP (Billions USD) | $ Billions | 600 | 15 | 1129 | ||
| 9 | Export of Goods and Services (in Million $) | Amount | 180,704 | 15 | 1126 | ||
| 10 | Corporate Tax Rates in % | Rate | 23 | 16 | 1127 | ||
| 11 | FTAs in India for Leisure (%) | % People | 42 | 19 | 1130 | ||
| 12 | INDs for Business (%) | % People | 25 | 21 | 1128 | ||
| 13 | FTAs in India via Delhi (%) | % People | 46 | 23 | 1126 | ||
| 14 | INDs via Bengaluru Airport (%) | % People | 5 | 23 | 1127 | ||
| 15 | FTAs in India via Bengaluru (%) | % People | 6 | 43 | 1129 | ||
| 16 | INDs via Mumbai Airport (%) | % People | 33 | 44 | 1128 | ||
| 17 | INDs - Indian Diaspora (%) | % People | 22 | 72 | 1128 | ||
|
Below World Average |
|||||||
| 1 | INDs via Cochin Airport (%) | % People | 3 | 123 | 1234 | ||
| 2 | INDs for Leisure (%) | % People | 46 | 151 | 1230 | ||
| 3 | INDs via Kolkata Airport (%) | % People | 2 | 96 | 1235 | ||
| 4 | FTAs in India via Mumbai (%) | % People | 23 | 142 | 1233 | ||
| 5 | FTAs in India - Indian Diaspora (%) | % People | 14 | 116 | 1230 | ||
| 6 | INDs via Hyderabad Airport (%) | % People | 3 | 110 | 1233 | ||
| 7 | FTAs in India via Kolkata (%) | % People | 2 | 89 | 1230 | ||
| 8 | INDs via Chennai Airport (%) | % People | 5 | 88 | 1230 | ||
| 9 | FTAs in India via Hyderabad (%) | % People | 3 | 75 | 1231 | ||
| 10 | FTAs in India for Education (%) | % People | 5 | 82 | 1233 | ||
| 11 | INDs via Delhi Airport (%) | % People | 38 | 108 | 1235 | ||
| 12 | FTAs in India via Chennai (%) | % People | 5 | 94 | 1233 | ||
| 13 | FTAs in India via Cochin (%) | % People | 3 | 80 | 1235 | ||
| 14 | Imports /Total GDP of the Country %. | 51 | 97 | 1234 | |||
| 15 | Exports/Total GDP of the Country %. | 48 | 85 | 1234 | |||
| 16 | FTAs in India for Business (%) | % People | 18 | 82 | 1232 | ||
| 17 | GDP Per Capita at PPP (USD) | $ | 30,199 | 78 | 1234 | ||
| 18 | INDs from India | # People | 158,494 | 77 | 1233 | ||
| 19 | GDP Per Capita (USD) | $ | 18,044 | 74 | 1230 | ||
| 20 | FTAs in India | # People | 51,254 | 52 | 1232 | ||
| 21 | No. of Companies Listed in NYSE | Count | 65 | 7 | 1234 | ||
| Sr. | Title | Metric | World Average | Rank out of 195 | Value | ||
|---|---|---|---|---|---|---|---|
|
Above World Average |
|||||||
| 1 | Christian Population | # People | 16,917,912 | 3 | 1126 | ||
| 2 | Christian Pop./Total Christian Pop.% | % People | 0 | 3 | 1130 | ||
| 3 | World Heritage Sites | Count | 7 | 7 | 1130 | ||
| 4 | Christian Pop./Total Pop.% | % People | 42 | 20 | 1128 | ||
|
Below World Average |
|||||||
| 1 | Islamic Population | # People | 10,091,996 | 146 | 1232 | ||
| 2 | Bronze Medal | Count | 5 | 37 | 1231 | ||
| 3 | Jewish Pop./Total Pop.% | % People | 0 | 42 | 1231 | ||
| 4 | Total Medals | Count | 12 | 40 | 1231 | ||
| 5 | # Olympic Medals | Count | 146 | 37 | 1232 | ||
| 6 | # Cannes Grand Prizes (Palme d'Or or Grand Prix) | 4 | 16 | 1235 | |||
| 7 | Share of Cannes Grand Prize Wins (% World) | 3 | 16 | 1235 | |||
| 8 | Silver Medal | Count | 5 | 22 | 1235 | ||
| 9 | # Oscar Wins – Best International Feature Film | 2 | 16 | 1230 | |||
| 10 | Share of Best International Feature Film Wins (% World) | 3 | 16 | 1233 | |||
| 11 | Jewish Population | # People | 162,421 | 14 | 1235 | ||
| 12 | Jewish Pop./Total Jewish Pop. % | % People | 0 | 14 | 1235 | ||
| Sr. | Title | Metric | World Average | Rank out of 195 | Value | ||
|---|---|---|---|---|---|---|---|
|
Above World Average |
|||||||
| 1 | # Theaters | Count | 310 | 5 | 1128 | ||
| 2 | Theaters/Total Theaters %. | Percent | 0 | 5 | 1127 | ||
| 3 | # Mobile phone numbers | Count | 40,393,496 | 14 | 1129 | ||
|
Below World Average |
|||||||
| 1 | # Phone Numbers /Total Pop. % | Percent | 101 | 124 | 1235 | ||
| 2 | Theaters per 100000 | Ratio | 1 | 30 | 1234 | ||
| Sr. | Title | Metric | World Average | Rank out of 195 | Value | ||
|---|---|---|---|---|---|---|---|
|
Above World Average |
|||||||
| 1 | Facebook users | # People | 11,706,915 | 6 | 1127 | ||
| 2 | X (Twitter) users | # People | 1,789,045 | 6 | 1129 | ||
| 3 | X (Twitter) Users as a % of Total X (Twitter) Users | % People | 0 | 6 | 1125 | ||
| 4 | Facebook Users as a % of Total facebook Users | % People | 0 | 6 | 1130 | ||
| 5 | Internet Users | # People | 28,543,790 | 7 | 1126 | ||
| 6 | LinkedIn users | # People | 7,145,162 | 7 | 1127 | ||
| 7 | LinkedIn Users as a % of Total LinkedIn Users | % People | 0 | 7 | 1127 | ||
| 8 | Instagram Users as a % of Total Instagram Users | % People | 0 | 7 | 1129 | ||
| 9 | Instagram Users | Absolute | 10,458,072 | 9 | 1130 | ||
| 10 | FB Users / Total Int. Users %. | % People | 34 | 20 | 1129 | ||
| 11 | FB Users / Total Pop. %. | % People | 27 | 26 | 1130 | ||
| 12 | X (Twitter) Users as a % of Total Internet Users | % People | 12 | 36 | 1128 | ||
| 13 | Instagram Users as a % of Total Population | % People | 29 | 63 | 1126 | ||
| 14 | Instagram Users as a % of Total Internet Users | % People | 36 | 63 | 1126 | ||
| 15 | Int. Users / Total Pop.% | % People | 69 | 89 | 1128 | ||
|
Below World Average |
|||||||
| 1 | Facebook CPC in Rs. | Absolute | 5 | 117 | 1233 | ||
| 2 | LinkedIn Users as a % of Total Internet Users | % People | 37 | 91 | 1234 | ||
| 3 | LinkedIn Users as a % of Total Population | % People | 34 | 88 | 1233 | ||
| 4 | X (Twitter) Users as a % of Total Population | % People | 13 | 38 | 1234 | ||
| Sr. | Title | Metric | World Average | Rank out of 195 | Value | ||
|---|---|---|---|---|---|---|---|
|
Above World Average |
|||||||
| 1 | Teachers in primary edu. | # People | 112,672 | 6 | 1128 | ||
| 2 | Enrolment in tertiary edu.(all programmes) | # People | 1,420,982 | 8 | 1126 | ||
| 3 | Teachers in tertiary edu. | # People | 80,879 | 8 | 1129 | ||
| 4 | Enrolment in secondary edu. | # People | 3,225,437 | 9 | 1130 | ||
| 5 | Teachers in secondary edu. | # People | 201,153 | 9 | 1129 | ||
| 6 | Total Literate Pop. | # People | 34,678,001 | 10 | 1125 | ||
| 7 | Enrolment in primary edu. | # People | 3,831,465 | 11 | 1125 | ||
| 8 | Literacy Rate (%) | % People | 86 | 100 | 1128 | ||
|
Below World Average |
|||||||
| 1 | # Students per teacher in tertiary edu. | Ratio | 58 | 93 | 1233 | ||
| 2 | Teachers as a % of Enrolment | % People | 41 | 68 | 1232 | ||
| 3 | # Students per teacher in Primary edu. | Ratio | 260 | 93 | 1232 | ||
| 4 | # Students per teacher in secondary edu. | Ratio | 57 | 84 | 1231 | ||
| 5 | Enrolment in Primary Edu./ Total Literate Pop %. | % People | 36 | 92 | 1233 | ||
| 6 | Enrolment in Tertiary Edu./ Total Pop. %. | % People | 9 | 50 | 1231 | ||
| 7 | Enrolment in Tertiary Edu/Total Literate Pop. %. | % People | 9 | 49 | 1234 | ||
| 8 | Enrolment in Primary Edu./Total Pop %. | % People | 27 | 83 | 1231 | ||
| 9 | # Total Teachers (Primary+Secondary+Tertiary) | # People | 2,895,876 | 8 | 1232 | ||
| 10 | Enrolment in Secondary Edu./Total Literate Pop. | % People | 28 | 43 | 1233 | ||
| 11 | # Total Students (Primary+Secondary+Tertiary) | # People | 38,831,325 | 9 | 1232 | ||
| 12 | Enrolment in Secondary Edu./Total Pop %. | % People | 23 | 26 | 1235 | ||
| Sr. | Title | Metric | World Average | Rank out of 195 | Value | ||
|---|---|---|---|---|---|---|---|
|
Above World Average |
|||||||
| 1 | Total No. of Doctors | # People | 78,648 | 7 | 1129 | ||
| 2 | Life Expectancy at Birth, both sexes | Age | 73 | 82 | 1127 | ||
| 3 | No. of people HIV infected/Total pop. | # People | 5,202 | 11 | 1125 | ||
|
Below World Average |
|||||||
| 1 | Dentist (per 10,000) | People per 10000 | 31 | 161 | 1231 | ||
| 2 | Dentist to doctor ratio | Ratio | 3 | 128 | 1234 | ||
| 3 | Total No. of Pharmacists | # People | 19,528 | 48 | 1234 | ||
| Sr. | Title | Metric | World Average | Rank out of 195 | Value | ||
|---|---|---|---|---|---|---|---|
|
Above World Average |
|||||||
| 1 | Police Officers | # People | 138,224 | 8 | 1125 | ||
| 2 | Total Military Force | # People | 362,682 | 26 | 1125 | ||
| 3 | Military Force/Total World Military Force %. | % People | 0 | 26 | 1130 | ||
|
Below World Average |
|||||||
| 1 | Military Force/Total Pop. % | % People | 1 | 103 | 1235 | ||
| 2 | Judges Per 100K | People Per 100K | 11 | 83 | 1232 | ||
| 3 | Military Budget (in Billion $) | $ Billion | 17 | 39 | 1233 | ||
| 4 | Military Budget/Total World Military Budget %. | Percent | 0 | 39 | 1232 | ||
| Sr. | Title | Metric | World Average | Rank out of 195 | Value | ||
|---|---|---|---|---|---|---|---|
|
Above World Average |
|||||||
| 1 | Formal Jobs | # People | 10,605,934 | 8 | 1126 | ||
| 2 | Employment in Services | # People | 10,251,634 | 9 | 1125 | ||
| 3 | Non-Agricultural Labour Force | # People | 15,067,127 | 9 | 1126 | ||
| 4 | Total Labour Force (2021) | # People | 20,641,663 | 11 | 1130 | ||
| 5 | Labour Force Participation | # People | 14,659,929 | 11 | 1126 | ||
| 6 | Employment in Agriculture | # People | 5,314,003 | 21 | 1125 | ||
| 7 | Unemployed Labour Force. | # People | 1,511,199 | 22 | 1127 | ||
| 8 | Employment in Services /Total pop.%. | % People | 25 | 72 | 1125 | ||
| 9 | Non-Agri Labour force/Total Labour force %. | % People | 76 | 74 | 1128 | ||
| 10 | Employment in Services / Total Labour Force %. | % People | 57 | 76 | 1128 | ||
| 11 | Total Labour Force/Total Pop. | % People | 43 | 76 | 1126 | ||
| 12 | Employment in services/Total Labour force %. | % People | 56 | 76 | 1128 | ||
| 13 | Wage & Salaried Workers / Total Labour Force % | % People | 59 | 78 | 1129 | ||
|
Below World Average |
|||||||
| 1 | Unemployment Rate. | % People | 6 | 115 | 1231 | ||
| 2 | Employment in Agri. / Total Labour Force % . | % People | 23 | 105 | 1234 | ||
| 3 | Employment in Agriculture/Total Labour force %. | % People | 23 | 105 | 1233 | ||
| 4 | Employment in Agriculture /Total Pop. %. | % People | 9 | 97 | 1233 | ||
| Sr. | Title | Metric | World Average | Rank out of 195 | Value | ||
|---|---|---|---|---|---|---|---|
|
Above World Average |
|||||||
| 1 | Total Population | # People | 42,357,833 | 11 | 1130 | ||
| 2 | Male Population | # People | 21,291,067 | 11 | 1128 | ||
| 3 | Female Population | # People | 21,066,765 | 11 | 1129 | ||
| 4 | Total Births | # People | 677,551 | 13 | 1129 | ||
| 5 | Female % of Total Pop. | % People | 50 | 32 | 1127 | ||
| 6 | Total Deaths | # People | 321,991 | 13 | 1129 | ||
|
Below World Average |
|||||||
| 1 | Male % of Total Pop. | % People | 50 | 164 | 1234 | ||
| 2 | Population Growth Rate (%) | % People | 0 | 104 | 1230 | ||
Mother Tongue : Spanish
Literacy Rate (%) : 95.20
| Country Capital | : | Mexico City |
|---|---|---|
| GDP Per Capita | : | 12,692 |
| GDP Per Capita Rank | : | 69th/195 |
| Life Expectancy | : | 75 |
| Unemployment Rate | : | 2 |
| Number of Internet Users | : | 107,967,499 |
| Internet Users Rank | : | 7th/195 |
| Area | : | 1,959,257 |
| Area Rank | : | 13th/195 |
| Total Population | : | 132,997,658 |
| Total Population Rank | : | 11th/195 |
| Sr. | City | Total City Population (2023) |
|---|---|---|
| 1 | Acapulco | 669,746 |
| 2 | Aguascalientes | 878,521 |
| 3 | Apatzingán | 104,133 |
| 4 | Apodaca | 545,478 |
| 5 | Buenavista | 220,469 |
| 6 | Cabo San Lucas | 206,131 |
| 7 | Campeche | 253,824 |
| 8 | Cancún | 903,842 |
| 9 | Celaya | 384,499 |
| 10 | Chalco de Díaz Covarrubias | 177,657 |
| 11 | Chetumal | 171,860 |
| 12 | Chicoloapan de Juárez | 196,775 |
| 13 | Chihuahua | 941,468 |
| 14 | Chilpancingo | 229,520 |
| 15 | Chimalhuacán | 715,101 |
| 16 | Cholula de Rivadabia | 104,031 |
| 17 | Ciudad Acuña | 162,911 |
| 18 | Ciudad Benito Juárez | 313,518 |
| 19 | Ciudad Cuauhtémoc | 137,895 |
| 20 | Ciudad de México | 9,365,771 |
| 21 | Ciudad del Carmen | 194,436 |
| 22 | Ciudad Guzmán | 113,896 |
| 23 | Ciudad Juárez | 1,527,013 |
| 24 | Ciudad López Mateos | 531,953 |
| 25 | Ciudad Madero | 209,385 |
| 26 | Ciudad Nezahualcóyotl | 1,090,855 |
| 27 | Ciudad Nicolás Romero | 328,975 |
| 28 | Ciudad Obregón | 334,975 |
| 29 | Ciudad Valles | 138,708 |
| 30 | Ciudad Victoria | 337,721 |
| 31 | Coatzacoalcos | 216,096 |
| 32 | Colima | 149,488 |
| 33 | Comitán | 115,421 |
| 34 | Córdoba | 141,454 |
| 35 | Cuautitlán | 119,997 |
| 36 | Cuautitlán Izcalli | 524,123 |
| 37 | Cuautla | 159,962 |
| 38 | Cuernavaca | 346,771 |
| 39 | Culiacán | 822,082 |
| 40 | Delicias | 130,776 |
| 41 | Durango | 626,527 |
| 42 | Ecatepec | 1,671,417 |
| 43 | Ensenada | 336,297 |
| 44 | Fresnillo | 145,725 |
| 45 | García | 238,672 |
| 46 | General Escobedo | 462,701 |
| 47 | Gómez Palacio | 306,806 |
| 48 | Guadalajara | 1,409,050 |
| 49 | Guadalupe | 646,662 |
| 50 | Guadalupe | 172,877 |
| 51 | Guaymas | 119,285 |
| 52 | Hermosillo | 870,080 |
| 53 | Iguala | 135,149 |
| 54 | Irapuato | 459,751 |
| 55 | Ixtapaluca | 374,838 |
| 56 | Jiutepec | 177,555 |
| 57 | Kanasín | 142,166 |
| 58 | Lagos de Moreno | 113,489 |
| 59 | La Paz | 254,333 |
| 60 | León | 1,606,537 |
| 61 | Los Mochis | 303,043 |
| 62 | Manzanillo | 162,606 |
| 63 | Matamoros | 519,343 |
| 64 | Mazatlán | 449,481 |
| 65 | Mérida | 937,401 |
| 66 | Mexicali | 868,657 |
| 67 | Minatitlán | 103,014 |
| 68 | Miramar | 164,538 |
| 69 | Monclova | 241,214 |
| 70 | Monterrey | 1,162,344 |
| 71 | Morelia | 755,880 |
| 72 | Naucalpan | 789,337 |
| 73 | Naucalpan (Huixquilucan) | 137,285 |
| 74 | Navojoa | 122,946 |
| 75 | Nogales | 265,519 |
| 76 | Nuevo Laredo | 423,142 |
| 77 | Oaxaca | 263,282 |
| 78 | Ojo de Agua | 392,838 |
| 79 | Orizaba | 122,539 |
| 80 | Pachuca | 302,840 |
| 81 | Parral | 115,726 |
| 82 | Piedras Negras | 176,945 |
| 83 | Playa del Carmen | 310,060 |
| 84 | Poza Rica | 183,148 |
| 85 | Puebla | 1,568,301 |
| 86 | Puerto Vallarta | 227,994 |
| 87 | Querétaro | 808,251 |
| 88 | Ramos Arizpe | 115,929 |
| 89 | Reynosa | 703,305 |
| 90 | Río Bravo | 113,184 |
| 91 | Rosarito | 102,404 |
| 92 | Salamanca | 163,420 |
| 93 | Saltillo | 879,029 |
| 94 | San Cristóbal de las Casas | 186,606 |
| 95 | San Francisco Coacalco | 298,162 |
| 96 | San Juan Bautista | 105,353 |
| 97 | San Juan del Río | 180,707 |
| 98 | San José del Cabo | 138,607 |
| 99 | San Luis Potosí | 860,216 |
| 100 | San Luis Río Colorado | 179,691 |
| 101 | San Nicolás de los Garza | 419,176 |
| 102 | San Pablo de las Salinas | 160,674 |
| 103 | San Pedro Garza García | 134,336 |
| 104 | Santa Catarina | 309,247 |
| 105 | Soledad de Graciano Sánchez | 315,450 |
| 106 | Tampico | 302,433 |
| 107 | Tapachula | 221,283 |
| 108 | Tehuacán | 298,772 |
| 109 | Temixco | 106,269 |
| 110 | Tepexpan | 122,844 |
| 111 | Tepic | 377,686 |
| 112 | Tijuana | 1,841,243 |
| 113 | Tlalnepantla | 670,051 |
| 114 | Tlaquepaque | 661,102 |
| 115 | Toluca | 227,689 |
| 116 | Tonalá | 449,887 |
| 117 | Torreón | 701,881 |
| 118 | Tulancingo | 107,997 |
| 119 | Tuxtla Gutiérrez | 588,596 |
| 120 | Uruapan | 304,569 |
| 121 | Veracruz | 412,871 |
| 122 | Veracruz (Boca del Río) | 134,234 |
| 123 | Villa de Álvarez | 149,996 |
| 124 | Villahermosa | 345,856 |
| 125 | Xalapa-Enríquez | 450,599 |
| 126 | Xico | 390,804 |
| 127 | Zacatecas | 140,742 |
| 128 | Zamora de Hidalgo | 157,115 |
| 129 | Zapopan | 1,278,782 |
Q - Does Prarang do surveys to collect data? How does Prarang have such granular
Country-level details which no private or public data source offers?
A - Prarang does not conduct surveys to gather data; instead, we rely on publicly available
sources such as UN Population data, the CIA World Factbook, and private surveys whose results
are accessible through news media and public websites. Our data classification follows a
three-fold method rooted in Indian logic (Tarkashastra): Pramana (evidence-based data
collection) involves gathering data from credible sources; Anumana (estimation and inference)
uses modeling to draw inferences from the collected data; and Upamana (comparison) ranks
countries through relative comparison, calculating the Samana (country average) to determine
whether each country ranks above or below this benchmark. All data sources and estimation
modeling methods are transparently detailed and accessible, with information available for each
data field by clicking the "i" icon.
A - Prarang does not do any surveys. It does data modeling & estimations based on third-party census & surveys, already in the public domain. It also shares the source of the data it uses. Users need to make their own judgment of how and for what purpose and when they use the data that they download from this Prarang website.