Analytics: World
Analytics: World
Date: June 23, 2026
 Pakistan is a large country with 2.9% of the world's population. Pakistan is a republic country. It has 6 world heritage sites. It is home to 12% Muslims of the world. It produces 1.4% Rice, 3.2% Wheat, 2.1% Potatoes, and 1.9% Onions of the world.
Pakistan is the 5th ranked country in population and 35th ranked in area out of 195 countries in the world. Please keep the country rank in perspective, for the highlights below.
 Teachers in secondary edu.
 Total Population
 Enrolment in primary edu.
Out of 195 countries in the world, Pakistan is the 3rd highest ranked in Rural Pop. . This implies that the economy of this country is majorly agriculture driven, or may imply that there is less industrialisation when compared to other countries.
Pakistan is the 4th highest ranked in Teachers in secondary edu. out of all the 195 countries.This implies better investment by the country in secondary education when compared to other countries.
Out of 195 countries in the world, Pakistan is the 5th highest ranked in Total Population . Taking into context the total population of the world, this country is more populated in comparison to other countries.
The Average Enrolment in primary edu. of 195 countries in the world is 3,831,465. Pakistan is the 5th highest ranked country out of 195 countries. This may take into context a higher country population, or imply that more people in this country pursue primary education when compared to other countries.
 Literacy Rate (%)
 GDP Per Capita (USD)
 Soyabean prod.
 Barley prod.
The Average Literacy Rate (%) of 195 countries in the world is 86. Pakistan is the 17th worst ranked country out of 195 countries. This indicates that the educational infrastructure in this country is worse than it is in other countries.
Pakistan is the 38th worst ranked in GDP Per Capita (USD) out of all the 195 countries.This implies that this country is a developing country.
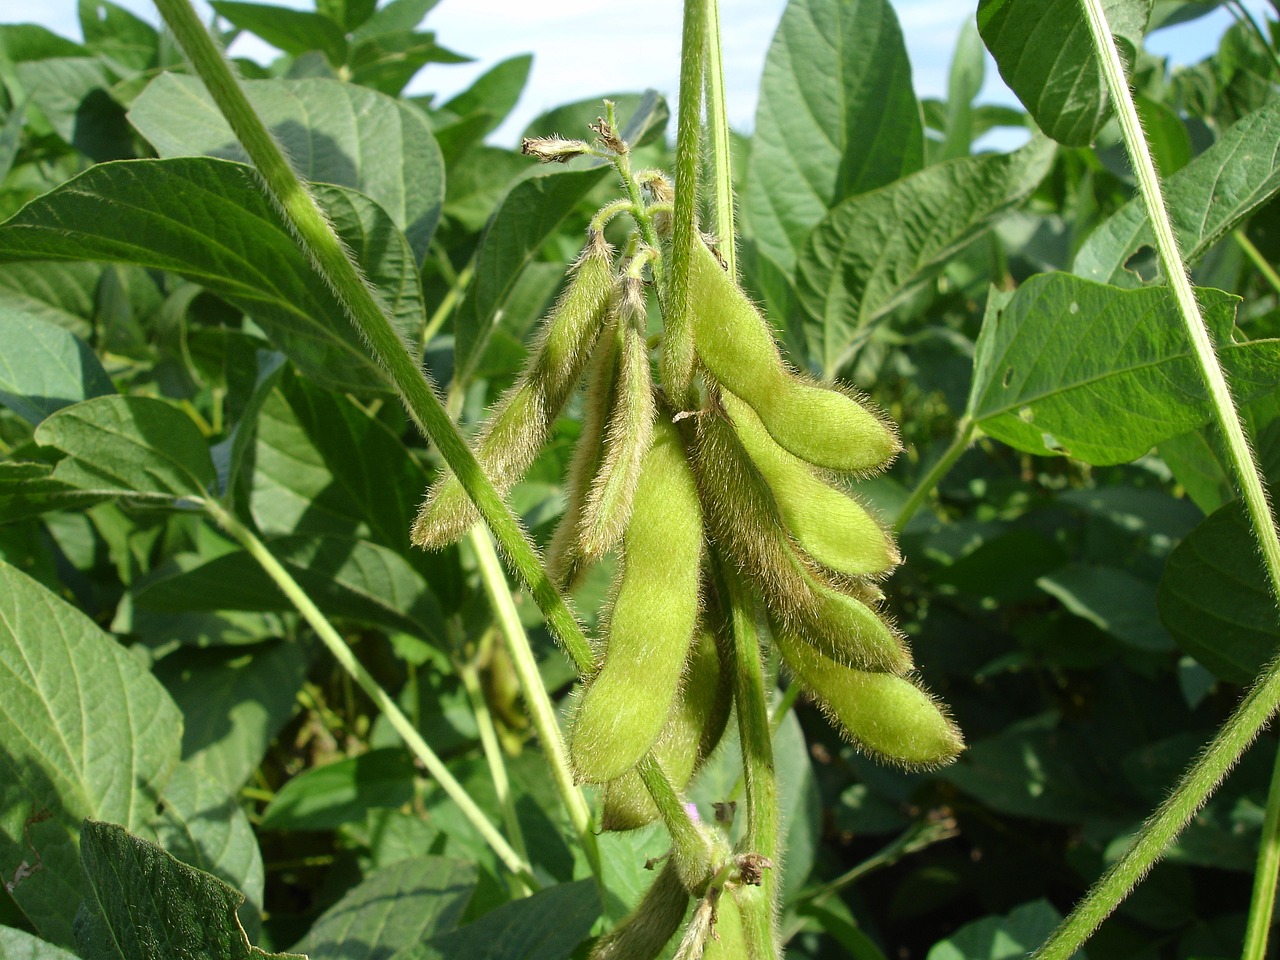
The Average Soyabean prod. of 195 countries in the world is 3,572,369. Pakistan is the 98th worst ranked country out of 195 countries. This is indicative of less focus on the production of soyabean, or scarcity of fertile land, or higher industrialisation as compared to other countries.
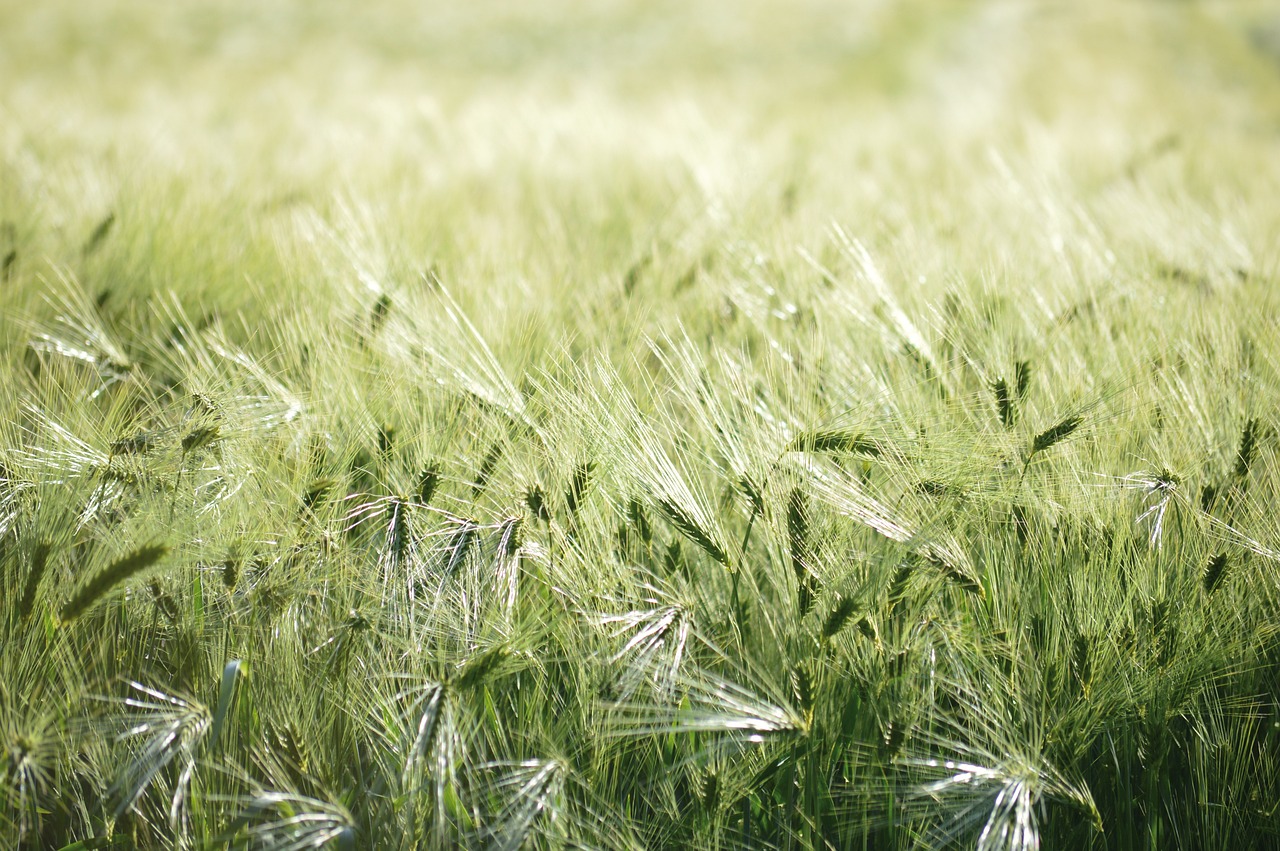
Out of 195 countries in the world, Pakistan is the 124th worst ranked in Barley prod. . This is indicative of less focus on the production of barley, or scarcity of fertile land, or higher industrialisation as compared to other countries.
| Sr. | Title | Metric | World Average | Rank out of 195 | Value | ||
|---|---|---|---|---|---|---|---|
|
Above World Average |
|||||||
| 1 | Gurumukhi | # People | 39,202,250 | 1 | 1128 | ||
| 2 | Pashto | # People | 25,256,000 | 1 | 1129 | ||
| 3 | Pashto as a % of total Pashto speakers | % People | 0 | 1 | 1127 | ||
| 4 | Urdu as a % of total Urdu speakers | % People | 0 | 1 | 1130 | ||
| 5 | English | # People | 10,677,446 | 2 | 1128 | ||
| 6 | Urdu | # People | 15,368,166 | 2 | 1128 | ||
| 7 | English as a % of total English speakers | % People | 0 | 2 | 1128 | ||
|
Below World Average |
|||||||
| 1 | Uzbek | # People | 1,668,438 | 8 | 1231 | ||
| 2 | Gujarati as a % of total Gujarati speakers | % People | 0 | 7 | 1232 | ||
| 3 | Uzbek as a % of total Uzbek speakers | % People | 0 | 7 | 1230 | ||
| 4 | Gujarati | # People | 3,567,082 | 2 | 1232 | ||
| Sr. | Title | Metric | World Average | Rank out of 195 | Value | ||
|---|---|---|---|---|---|---|---|
|
Above World Average |
|||||||
| 1 | Cricket Playing Nations (ICC Members) | Count | 1 | 1 | 1127 | ||
| 2 | Islamic Population | # People | 10,091,996 | 2 | 1129 | ||
| 3 | Islamic Pop./Total Islamic Pop.% | % People | 0 | 2 | 1126 | ||
| 4 | Islamic Pop./Total Pop.% | % People | 22 | 4 | 1130 | ||
|
Below World Average |
|||||||
| 1 | Total Medals | Count | 12 | 68 | 1235 | ||
| 2 | # Olympic Medals | Count | 146 | 78 | 1231 | ||
| 3 | World Heritage Sites | Count | 7 | 59 | 1233 | ||
| 4 | Gold Medal | Count | 5 | 38 | 1232 | ||
| 5 | Hindu Pop./Total Pop.%. | % People | 2 | 19 | 1235 | ||
| 6 | Hindu Population | # People | 52,631,217 | 4 | 1230 | ||
| 7 | Hindu Pop./Total Hindu Pop.% | % People | 0 | 4 | 1231 | ||
| Sr. | Title | Metric | World Average | Rank out of 195 | Value | ||
|---|---|---|---|---|---|---|---|
|
Above World Average |
|||||||
| 1 | INDs for Leisure (%) | % People | 46 | 1 | 1130 | ||
| 2 | INDs for Pilgrimage (%) | % People | 5 | 1 | 1126 | ||
| 3 | Import Ban(Number of products) | Count | 12 | 23 | 1129 | ||
| 4 | Corporate Tax Rates in % | Rate | 23 | 52 | 1126 | ||
|
Below World Average |
|||||||
| 1 | FTAs in India via Delhi (%) | % People | 46 | 193 | 1230 | ||
| 2 | INDs via Delhi Airport (%) | % People | 38 | 194 | 1230 | ||
| 3 | INDs for Business (%) | % People | 25 | 185 | 1232 | ||
| 4 | INDs via Chennai Airport (%) | % People | 5 | 172 | 1233 | ||
| 5 | FTAs in India via Mumbai (%) | % People | 23 | 180 | 1235 | ||
| 6 | FTAs in India - Indian Diaspora (%) | % People | 14 | 172 | 1231 | ||
| 7 | INDs via Mumbai Airport (%) | % People | 33 | 182 | 1233 | ||
| 8 | INDs - Indian Diaspora (%) | % People | 22 | 175 | 1232 | ||
| 9 | FTAs in India for Business (%) | % People | 18 | 157 | 1232 | ||
| 10 | Exports/Total GDP of the Country %. | 48 | 162 | 1233 | |||
| 11 | GDP Per Capita (USD) | $ | 18,044 | 158 | 1235 | ||
| 12 | Imports /Total GDP of the Country %. | 51 | 151 | 1233 | |||
| 13 | GDP Per Capita at PPP (USD) | $ | 30,199 | 143 | 1232 | ||
| 14 | INDs via Ahmedabad Airport (%) | % People | 1 | 61 | 1230 | ||
| 15 | FTAs in India for Leisure (%) | % People | 42 | 100 | 1233 | ||
| 16 | FTAs in India for Medical (%) | % People | 12 | 76 | 1233 | ||
| 17 | Exports /Total Exports of the World %. | 0 | 66 | 1230 | |||
| 18 | Export of Goods and Services (in Million $) | Amount | 180,704 | 66 | 1233 | ||
| 19 | FDI (millions USD) | Amount | 3,288 | 65 | 1233 | ||
| 20 | FDI / Total FDI of the World %. | 0 | 63 | 1230 | |||
| 21 | Imports/Total Imports of the World %. | 0 | 57 | 1233 | |||
| 22 | Import of Goods and Services (in Million $) | Amount | 173,515 | 57 | 1234 | ||
| 23 | INDs from India | # People | 158,494 | 54 | 1234 | ||
| 24 | INDs for Education (%) | % People | 3 | 47 | 1235 | ||
| 25 | FTAs in India | # People | 51,254 | 47 | 1230 | ||
| 26 | GDP as a % of Total GDP | Percent | 0 | 42 | 1230 | ||
| 27 | GDP (Billions USD) | $ Billions | 600 | 42 | 1231 | ||
| Sr. | Title | Metric | World Average | Rank out of 195 | Value | ||
|---|---|---|---|---|---|---|---|
|
Above World Average |
|||||||
| 1 | # Cities>10M | # Cities | 1 | 2 | 1129 | ||
| 2 | # Cities>5M | # Cities | 1 | 3 | 1125 | ||
| 3 | Rural Pop. | # People | 18,013,759 | 3 | 1129 | ||
| 4 | # Cities>5M | # Cities | 0 | 3 | 1129 | ||
| 5 | # Cities>1M | # Cities | 4 | 9 | 1127 | ||
| 6 | Urban Population (2021) | # People | 23,603,754 | 10 | 1130 | ||
| 7 | # Cities>100000 | # Cities | 27 | 10 | 1125 | ||
| 8 | # Cities>1M | # Cities | 1 | 12 | 1128 | ||
| 9 | # Cities>300000 | # Cities | 11 | 13 | 1125 | ||
| 10 | # Cities>500000 | # Cities | 7 | 15 | 1130 | ||
| 11 | # Cities>500000 | # Cities | 4 | 19 | 1125 | ||
| 12 | # Cities>100000 | # Cities | 21 | 21 | 1128 | ||
| 13 | # Cities>300000 | # Cities | 7 | 21 | 1130 | ||
| 14 | Rural Pop. /Total Pop. % | % People | 40 | 40 | 1125 | ||
| 15 | Pop. with access to Electricity (%) | % People | 86 | 126 | 1130 | ||
| 16 | Pop. without Electricity access | # People | 3,455,508 | 17 | 1129 | ||
|
Below World Average |
|||||||
| 1 | Urban Population / Total Population % . | % People | 60 | 156 | 1234 | ||
| Sr. | Title | Metric | World Average | Rank out of 195 | Value | ||
|---|---|---|---|---|---|---|---|
|
Above World Average |
|||||||
| 1 | Buffalo Milk Production (in tonnes) | Weight | 7,516,792 | 2 | 1129 | ||
| 2 | Buffalo Milk Production (% of Total Buffalo Milk Production) | Percent | 4 | 2 | 1126 | ||
| 3 | Goat Milk Production (in tonnes) | Weight | 196,989 | 3 | 1130 | ||
| 4 | Goat Meat Production (in tonnes) | Weight | 46,111 | 3 | 1127 | ||
| 5 | Goat Milk Production (% of Total Goat Milk Production) | Percent | 0 | 3 | 1125 | ||
| 6 | Goat Meat Production (% of Total Goat Meat Production) | Percent | 0 | 3 | 1129 | ||
| 7 | Sugarcane prod. | Tons | 20,929,075 | 5 | 1125 | ||
| 8 | Sugarcane Produced/Total Sugarcane Produced.% | Weight | 2 | 5 | 1125 | ||
| 9 | Cotton Production (in 1000 480 lb. Bales) | Weight | 1,707 | 5 | 1126 | ||
| 10 | Cotton Production (% of Total Cotton Production) | Percent | 1 | 5 | 1126 | ||
| 11 | Number of Cows | Count | 8,697,624 | 6 | 1129 | ||
| 12 | Cow Milk Production (in tonnes) | Weight | 3,855,383 | 6 | 1125 | ||
| 13 | Cows (% of Total Cows) | Percent | 0 | 6 | 1129 | ||
| 14 | Cow Milk Production (% of Total Cow Milk Production) | Percent | 0 | 6 | 1126 | ||
| 15 | Onion prod. | Tons | 819,042 | 7 | 1126 | ||
| 16 | Onion Produced/Total Onion Produced % | Weight | 0 | 7 | 1125 | ||
| 17 | Wheat prod. | Tons | 6,811,171 | 8 | 1125 | ||
| 18 | Wheat Produced /Total Wheat Produced. %. | Weight | 0 | 8 | 1126 | ||
| 19 | Potatoes prod. | Tons | 2,504,846 | 9 | 1125 | ||
| 20 | Potatoes Produced /Total Potatoes Produced % | Weight | 0 | 9 | 1129 | ||
| 21 | Rice prod. | Tons | 6,920,442 | 10 | 1130 | ||
| 22 | Rice Produced/Total Rice Produced.% | Weight | 0 | 10 | 1126 | ||
| 23 | Cow Beef Production (in tonnes) | Weight | 320,761 | 10 | 1128 | ||
| 24 | Cow Beef Production (% of Total Cow Beef Production) | Percent | 0 | 10 | 1129 | ||
| 25 | Chicken Meat Production (in tonnes) | Weight | 588,164 | 11 | 1129 | ||
| 26 | Chicken Meat Production (% of Total Chicken Meat Production) | Percent | 0 | 11 | 1127 | ||
|
Below World Average |
|||||||
| 1 | Flourite Produced/Total Flourite Produced % | Weight | 4 | 22 | 1233 | ||
| 2 | Uranium Produced/Total Uranium Produced % | Weight | 5 | 12 | 1230 | ||
| 3 | Tree density . | Density | 828 | 170 | 1232 | ||
| 4 | Tree density. | Density | 22,685 | 166 | 1234 | ||
| 5 | Oil Prodcuced/Total Oil Produced % | 5 | 45 | 1231 | |||
| 6 | Natural Gas Produced/Total Natural Gas Produced % | Mass | 5 | 21 | 1231 | ||
| 7 | Soyabean prod. | Tons | 3,572,369 | 98 | 1232 | ||
| 8 | Country forest area / Global Forest area % | 0 | 79 | 1232 | |||
| 9 | Forest Area. | Area | 21,595,147 | 79 | 1231 | ||
| 10 | Barley Produced/Total Barley Produced.% | Weight | 1 | 71 | 1233 | ||
| 11 | Barley prod. | Tons | 1,545,003 | 72 | 1235 | ||
| 12 | Sweet Potatoes prod. | Tons | 878,129 | 66 | 1230 | ||
| 13 | Sweet Potatoes Produced/Total Sweet Potatoes Produced % | Weight | 0 | 62 | 1235 | ||
| 14 | Honey Produced /Total Honey Produced % | Weight | 0 | 45 | 1234 | ||
| 15 | Honey prod. | Tons | 15,393 | 46 | 1230 | ||
| 16 | Oil Prod. | Barrels/day | 855,887 | 45 | 1232 | ||
| 17 | Orange Production (% of Total Orange Production) | Percent | 0 | 44 | 1233 | ||
| 18 | Orange Production (in tonnes) | Weight | 618,959 | 44 | 1230 | ||
| 19 | Iron Production (% of Total Iron Production) | Percent | 2 | 37 | 1234 | ||
| 20 | Iron Production (in 1000 metric tons) | Weight | 33,258 | 38 | 1234 | ||
| 21 | Coal Production (in 1000 metric tons) | Weight | 121,850 | 23 | 1233 | ||
| 22 | Coal Production (% of Total Coal Production) | Percent | 1 | 23 | 1231 | ||
| 23 | Flourite prod. | Tons | 231,501 | 22 | 1235 | ||
| 24 | Natural Gas Prod. | Million cubic meters | 43,738 | 21 | 1234 | ||
| 25 | Apple Production (in tonnes) | Weight | 1,044,287 | 18 | 1234 | ||
| 26 | Apple Production (% of Total Apple Production) | Percent | 1 | 18 | 1230 | ||
| 27 | Uranium prod. | Tons | 3,187 | 12 | 1235 | ||
| 28 | Number of Trees | Count | 15,642,617,148 | 3 | 1230 | ||
| Sr. | Title | Metric | World Average | Rank out of 195 | Value | ||
|---|---|---|---|---|---|---|---|
|
Above World Average |
|||||||
| 1 | Police Officers | # People | 138,224 | 3 | 1125 | ||
| 2 | Total Military Force | # People | 362,682 | 10 | 1129 | ||
| 3 | Military Force/Total World Military Force %. | % People | 0 | 10 | 1128 | ||
|
Below World Average |
|||||||
| 1 | Military Force/Total Pop. % | % People | 1 | 75 | 1235 | ||
| 2 | Military Budget (in Billion $) | $ Billion | 17 | 24 | 1232 | ||
| 3 | Military Budget/Total World Military Budget %. | Percent | 0 | 24 | 1235 | ||
| Sr. | Title | Metric | World Average | Rank out of 195 | Value | ||
|---|---|---|---|---|---|---|---|
|
Above World Average |
|||||||
| 1 | Total Births | # People | 677,551 | 4 | 1127 | ||
| 2 | Total Population | # People | 42,357,833 | 5 | 1130 | ||
| 3 | Male Population | # People | 21,291,067 | 5 | 1128 | ||
| 4 | Female Population | # People | 21,066,765 | 5 | 1129 | ||
| 5 | Male % of Total Pop. | % People | 50 | 36 | 1127 | ||
| 6 | Population Growth Rate (%) | % People | 0 | 59 | 1126 | ||
| 7 | Total Deaths | # People | 321,991 | 7 | 1130 | ||
|
Below World Average |
|||||||
| 1 | Female % of Total Pop. | % People | 50 | 159 | 1233 | ||
| Sr. | Title | Metric | World Average | Rank out of 195 | Value | ||
|---|---|---|---|---|---|---|---|
|
Above World Average |
|||||||
| 1 | Teachers in secondary edu. | # People | 201,153 | 4 | 1127 | ||
| 2 | Enrolment in primary edu. | # People | 3,831,465 | 5 | 1128 | ||
| 3 | Total Literate Pop. | # People | 34,678,001 | 6 | 1129 | ||
| 4 | # Total Students (Primary+Secondary+Tertiary) | # People | 38,831,325 | 7 | 1127 | ||
| 5 | Enrolment in secondary edu. | # People | 3,225,437 | 8 | 1126 | ||
| 6 | Teachers in primary edu. | # People | 112,672 | 9 | 1125 | ||
| 7 | Enrolment in tertiary edu.(all programmes) | # People | 1,420,982 | 25 | 1127 | ||
|
Below World Average |
|||||||
| 1 | Literacy Rate (%) | % People | 86 | 179 | 1232 | ||
| 2 | Enrolment in Tertiary Edu./ Total Pop. %. | % People | 9 | 133 | 1234 | ||
| 3 | Enrolment in Tertiary Edu/Total Literate Pop. %. | % People | 9 | 120 | 1230 | ||
| 4 | Enrolment in Secondary Edu./Total Pop %. | % People | 23 | 150 | 1230 | ||
| 5 | Teachers as a % of Enrolment | % People | 41 | 81 | 1230 | ||
| 6 | Enrolment in Primary Edu./Total Pop %. | % People | 27 | 91 | 1232 | ||
| 7 | # Students per teacher in tertiary edu. | Ratio | 58 | 8 | 1231 | ||
| 8 | # Total Teachers (Primary+Secondary+Tertiary) | # People | 2,895,876 | 7 | 1231 | ||
| 9 | Enrolment in Secondary Edu./Total Literate Pop. | % People | 28 | 49 | 1232 | ||
| 10 | Enrolment in Primary Edu./ Total Literate Pop %. | % People | 36 | 44 | 1231 | ||
| 11 | Teachers in tertiary edu. | # People | 80,879 | 33 | 1234 | ||
| Sr. | Title | Metric | World Average | Rank out of 195 | Value | ||
|---|---|---|---|---|---|---|---|
|
Above World Average |
|||||||
| 1 | Employment in Agriculture | # People | 5,314,003 | 6 | 1127 | ||
| 2 | Unemployed Labour Force. | # People | 1,511,199 | 6 | 1126 | ||
| 3 | Total Labour Force (2021) | # People | 20,641,663 | 7 | 1125 | ||
| 4 | Labour Force Participation | # People | 14,659,929 | 9 | 1128 | ||
| 5 | Non-Agricultural Labour Force | # People | 15,067,127 | 10 | 1125 | ||
| 6 | Formal Jobs | # People | 10,605,934 | 11 | 1127 | ||
| 7 | Employment in Services | # People | 10,251,634 | 12 | 1129 | ||
| 8 | Employment in Agri. / Total Labour Force % . | % People | 23 | 43 | 1130 | ||
| 9 | Employment in Agriculture/Total Labour force %. | % People | 23 | 43 | 1127 | ||
| 10 | Unemployment Rate. | % People | 6 | 45 | 1128 | ||
| 11 | Employment in Agriculture /Total Pop. %. | % People | 9 | 56 | 1130 | ||
|
Below World Average |
|||||||
| 1 | Employment in Services /Total pop.%. | % People | 25 | 151 | 1231 | ||
| 2 | Total Labour Force/Total Pop. | % People | 43 | 149 | 1230 | ||
| 3 | Employment in Services / Total Labour Force %. | % People | 57 | 146 | 1234 | ||
| 4 | Employment in services/Total Labour force %. | % People | 56 | 146 | 1231 | ||
| 5 | Non-Agri Labour force/Total Labour force %. | % People | 76 | 135 | 1230 | ||
| 6 | Wage & Salaried Workers / Total Labour Force % | % People | 59 | 125 | 1235 | ||
| Sr. | Title | Metric | World Average | Rank out of 195 | Value | ||
|---|---|---|---|---|---|---|---|
|
Above World Average |
|||||||
| 1 | Facebook users | # People | 11,706,915 | 9 | 1130 | ||
| 2 | Facebook Users as a % of Total facebook Users | % People | 0 | 9 | 1129 | ||
| 3 | Internet Users | # People | 28,543,790 | 12 | 1125 | ||
| 4 | LinkedIn users | # People | 7,145,162 | 13 | 1126 | ||
| 5 | LinkedIn Users as a % of Total LinkedIn Users | % People | 0 | 13 | 1127 | ||
| 6 | Instagram Users as a % of Total Instagram Users | % People | 0 | 16 | 1130 | ||
| 7 | Instagram Users | Absolute | 10,458,072 | 18 | 1130 | ||
| 8 | X (Twitter) users | # People | 1,789,045 | 26 | 1130 | ||
| 9 | X (Twitter) Users as a % of Total X (Twitter) Users | % People | 0 | 26 | 1130 | ||
|
Below World Average |
|||||||
| 1 | Facebook CPC in Rs. | Absolute | 5 | 177 | 1230 | ||
| 2 | Int. Users / Total Pop.% | % People | 69 | 168 | 1235 | ||
| 3 | X (Twitter) Users as a % of Total Population | % People | 13 | 140 | 1230 | ||
| 4 | Instagram Users as a % of Total Population | % People | 29 | 135 | 1230 | ||
| 5 | LinkedIn Users as a % of Total Population | % People | 34 | 134 | 1230 | ||
| 6 | FB Users / Total Pop. %. | % People | 27 | 131 | 1235 | ||
| 7 | Instagram Users as a % of Total Internet Users | % People | 36 | 126 | 1232 | ||
| 8 | X (Twitter) Users as a % of Total Internet Users | % People | 12 | 120 | 1230 | ||
| 9 | FB Users / Total Int. Users %. | % People | 34 | 113 | 1232 | ||
| 10 | LinkedIn Users as a % of Total Internet Users | % People | 37 | 105 | 1231 | ||
| Sr. | Title | Metric | World Average | Rank out of 195 | Value | ||
|---|---|---|---|---|---|---|---|
|
Above World Average |
|||||||
| 1 | Total No. of Doctors | # People | 78,648 | 9 | 1128 | ||
| 2 | Total No. of Pharmacists | # People | 19,528 | 17 | 1127 | ||
|
Below World Average |
|||||||
| 1 | Dentist (per 10,000) | People per 10000 | 31 | 150 | 1232 | ||
| 2 | Life Expectancy at Birth, both sexes | Age | 73 | 144 | 1230 | ||
| Sr. | Title | Metric | World Average | Rank out of 195 | Value | ||
|---|---|---|---|---|---|---|---|
|
Above World Average |
|||||||
| 1 | # Mobile phone numbers | Count | 40,393,496 | 10 | 1125 | ||
|
Below World Average |
|||||||
| 1 | # Phone Numbers /Total Pop. % | Percent | 101 | 161 | 1234 | ||
| 2 | Theaters per 100000 | Ratio | 1 | 56 | 1231 | ||
| 3 | # Theaters | Count | 310 | 29 | 1235 | ||
| 4 | Theaters/Total Theaters %. | Percent | 0 | 29 | 1235 | ||
Mother Tongue : Gurumukhi
Literacy Rate (%) : 58.00
| Country Capital | : | Islamabad |
|---|---|---|
| GDP Per Capita | : | 1,459 |
| GDP Per Capita Rank | : | 161st/195 |
| Life Expectancy | : | 68 |
| Unemployment Rate | : | 6 |
| Number of Internet Users | : | 85,439,281 |
| Internet Users Rank | : | 12th/195 |
| Area | : | 770,880 |
| Area Rank | : | 35th/195 |
| Total Population | : | 259,299,791 |
| Total Population Rank | : | 5th/195 |
| Sr. | City | Total City Population (2023) |
|---|---|---|
| 1 | Abbottabad | 232,196 |
| 2 | Ahmadpur East | 148,918 |
| 3 | Arifwala | 125,364 |
| 4 | Attock | 163,877 |
| 5 | Badin | 125,475 |
| 6 | Bahawalnagar | 179,617 |
| 7 | Bahawalpur | 851,534 |
| 8 | Bhakkar | 125,922 |
| 9 | Bhalwal | 148,360 |
| 10 | Burewala | 258,988 |
| 11 | Chakwal | 154,276 |
| 12 | Chaman | 137,531 |
| 13 | Charsadda | 127,931 |
| 14 | Chiniot | 310,897 |
| 15 | Chishtian | 166,556 |
| 16 | Dadu | 191,227 |
| 17 | Daska | 195,804 |
| 18 | Dera Ghazi Khan | 443,628 |
| 19 | Dera Ismail Khan | 243,359 |
| 20 | Faisalabad | 3,583,633 |
| 21 | Firozwala | 157,625 |
| 22 | Ghotki | 124,359 |
| 23 | Gojra | 195,134 |
| 24 | Gujranwala | 2,264,357 |
| 25 | Gujranwala Cantonment | 152,825 |
| 26 | Gujrat | 436,261 |
| 27 | Hafizabad | 274,393 |
| 28 | Harunabad | 120,228 |
| 29 | Hasilpur | 129,047 |
| 30 | Hub | 198,483 |
| 31 | Hyderabad | 1,935,264 |
| 32 | Islamabad | 1,126,374 |
| 33 | Jacobabad | 213,330 |
| 34 | Jaranwala | 168,230 |
| 35 | Jatoi | 122,238 |
| 36 | Jhang | 462,494 |
| 37 | Jhelum | 212,660 |
| 38 | Kabal | 131,727 |
| 39 | Kamalia | 151,486 |
| 40 | Kambar Ali Khan | 112,749 |
| 41 | Kamoki | 277,742 |
| 42 | Kandhkot | 112,637 |
| 43 | Karachi | 16,615,856 |
| 44 | Kasur | 399,980 |
| 45 | Khairpur | 204,399 |
| 46 | Khanewal | 278,970 |
| 47 | Khanpur | 205,851 |
| 48 | Khushab | 133,289 |
| 49 | Khuzdar | 203,618 |
| 50 | Kohat | 255,192 |
| 51 | Kot Abdul Malik | 159,746 |
| 52 | Kot Addu | 145,011 |
| 53 | Kotri | 112,861 |
| 54 | Lahore | 12,413,555 |
| 55 | Larkana | 544,768 |
| 56 | Layyah | 140,769 |
| 57 | Lodhran | 131,503 |
| 58 | Mandi Bahauddin | 221,703 |
| 59 | Mansehra | 142,443 |
| 60 | Mardan | 400,761 |
| 61 | Mianwali | 132,731 |
| 62 | Mingawara | 369,951 |
| 63 | Mirpur Khas | 261,332 |
| 64 | Multan | 2,090,434 |
| 65 | Muridke | 186,538 |
| 66 | Murree | 175,263 |
| 67 | Muzaffargarh | 234,317 |
| 68 | Narowal | 115,093 |
| 69 | Nawabshah | 311,790 |
| 70 | Nowshera | 134,294 |
| 71 | Okara | 399,757 |
| 72 | Pakpattan | 197,255 |
| 73 | Peshawar | 2,198,941 |
| 74 | Quetta | 1,115,657 |
| 75 | Rahimyar Khan | 469,974 |
| 76 | Rawalpindi | 2,341,831 |
| 77 | Sadiqabad | 266,021 |
| 78 | Sahiwal | 434,028 |
| 79 | Sambrial | 122,126 |
| 80 | Samundri | 175,152 |
| 81 | Sargodha | 734,766 |
| 82 | Shahdadkot | 132,731 |
| 83 | Sheikhupura | 528,358 |
| 84 | Shikarpur | 219,023 |
| 85 | Sialkot | 733,092 |
| 86 | Sukkur | 558,610 |
| 87 | Swabi | 137,755 |
| 88 | Tando Adam | 169,682 |
| 89 | Tando Allahyar | 181,738 |
| 90 | Tando Muhammad Khan | 113,754 |
| 91 | Taxila | 136,192 |
| 92 | Turbat | 238,671 |
| 93 | Umerkot | 149,811 |
| 94 | Vehari | 162,537 |
| 95 | Wah Cantonment | 423,646 |
| 96 | Wazirabad | 143,001 |
Q - Does Prarang do surveys to collect data? How does Prarang have such granular
Country-level details which no private or public data source offers?
A - Prarang does not conduct surveys to gather data; instead, we rely on publicly available
sources such as UN Population data, the CIA World Factbook, and private surveys whose results
are accessible through news media and public websites. Our data classification follows a
three-fold method rooted in Indian logic (Tarkashastra): Pramana (evidence-based data
collection) involves gathering data from credible sources; Anumana (estimation and inference)
uses modeling to draw inferences from the collected data; and Upamana (comparison) ranks
countries through relative comparison, calculating the Samana (country average) to determine
whether each country ranks above or below this benchmark. All data sources and estimation
modeling methods are transparently detailed and accessible, with information available for each
data field by clicking the "i" icon.
A - Prarang does not do any surveys. It does data modeling & estimations based on third-party census & surveys, already in the public domain. It also shares the source of the data it uses. Users need to make their own judgment of how and for what purpose and when they use the data that they download from this Prarang website.