Analytics: India
Analytics: India
Date: July 29, 2026
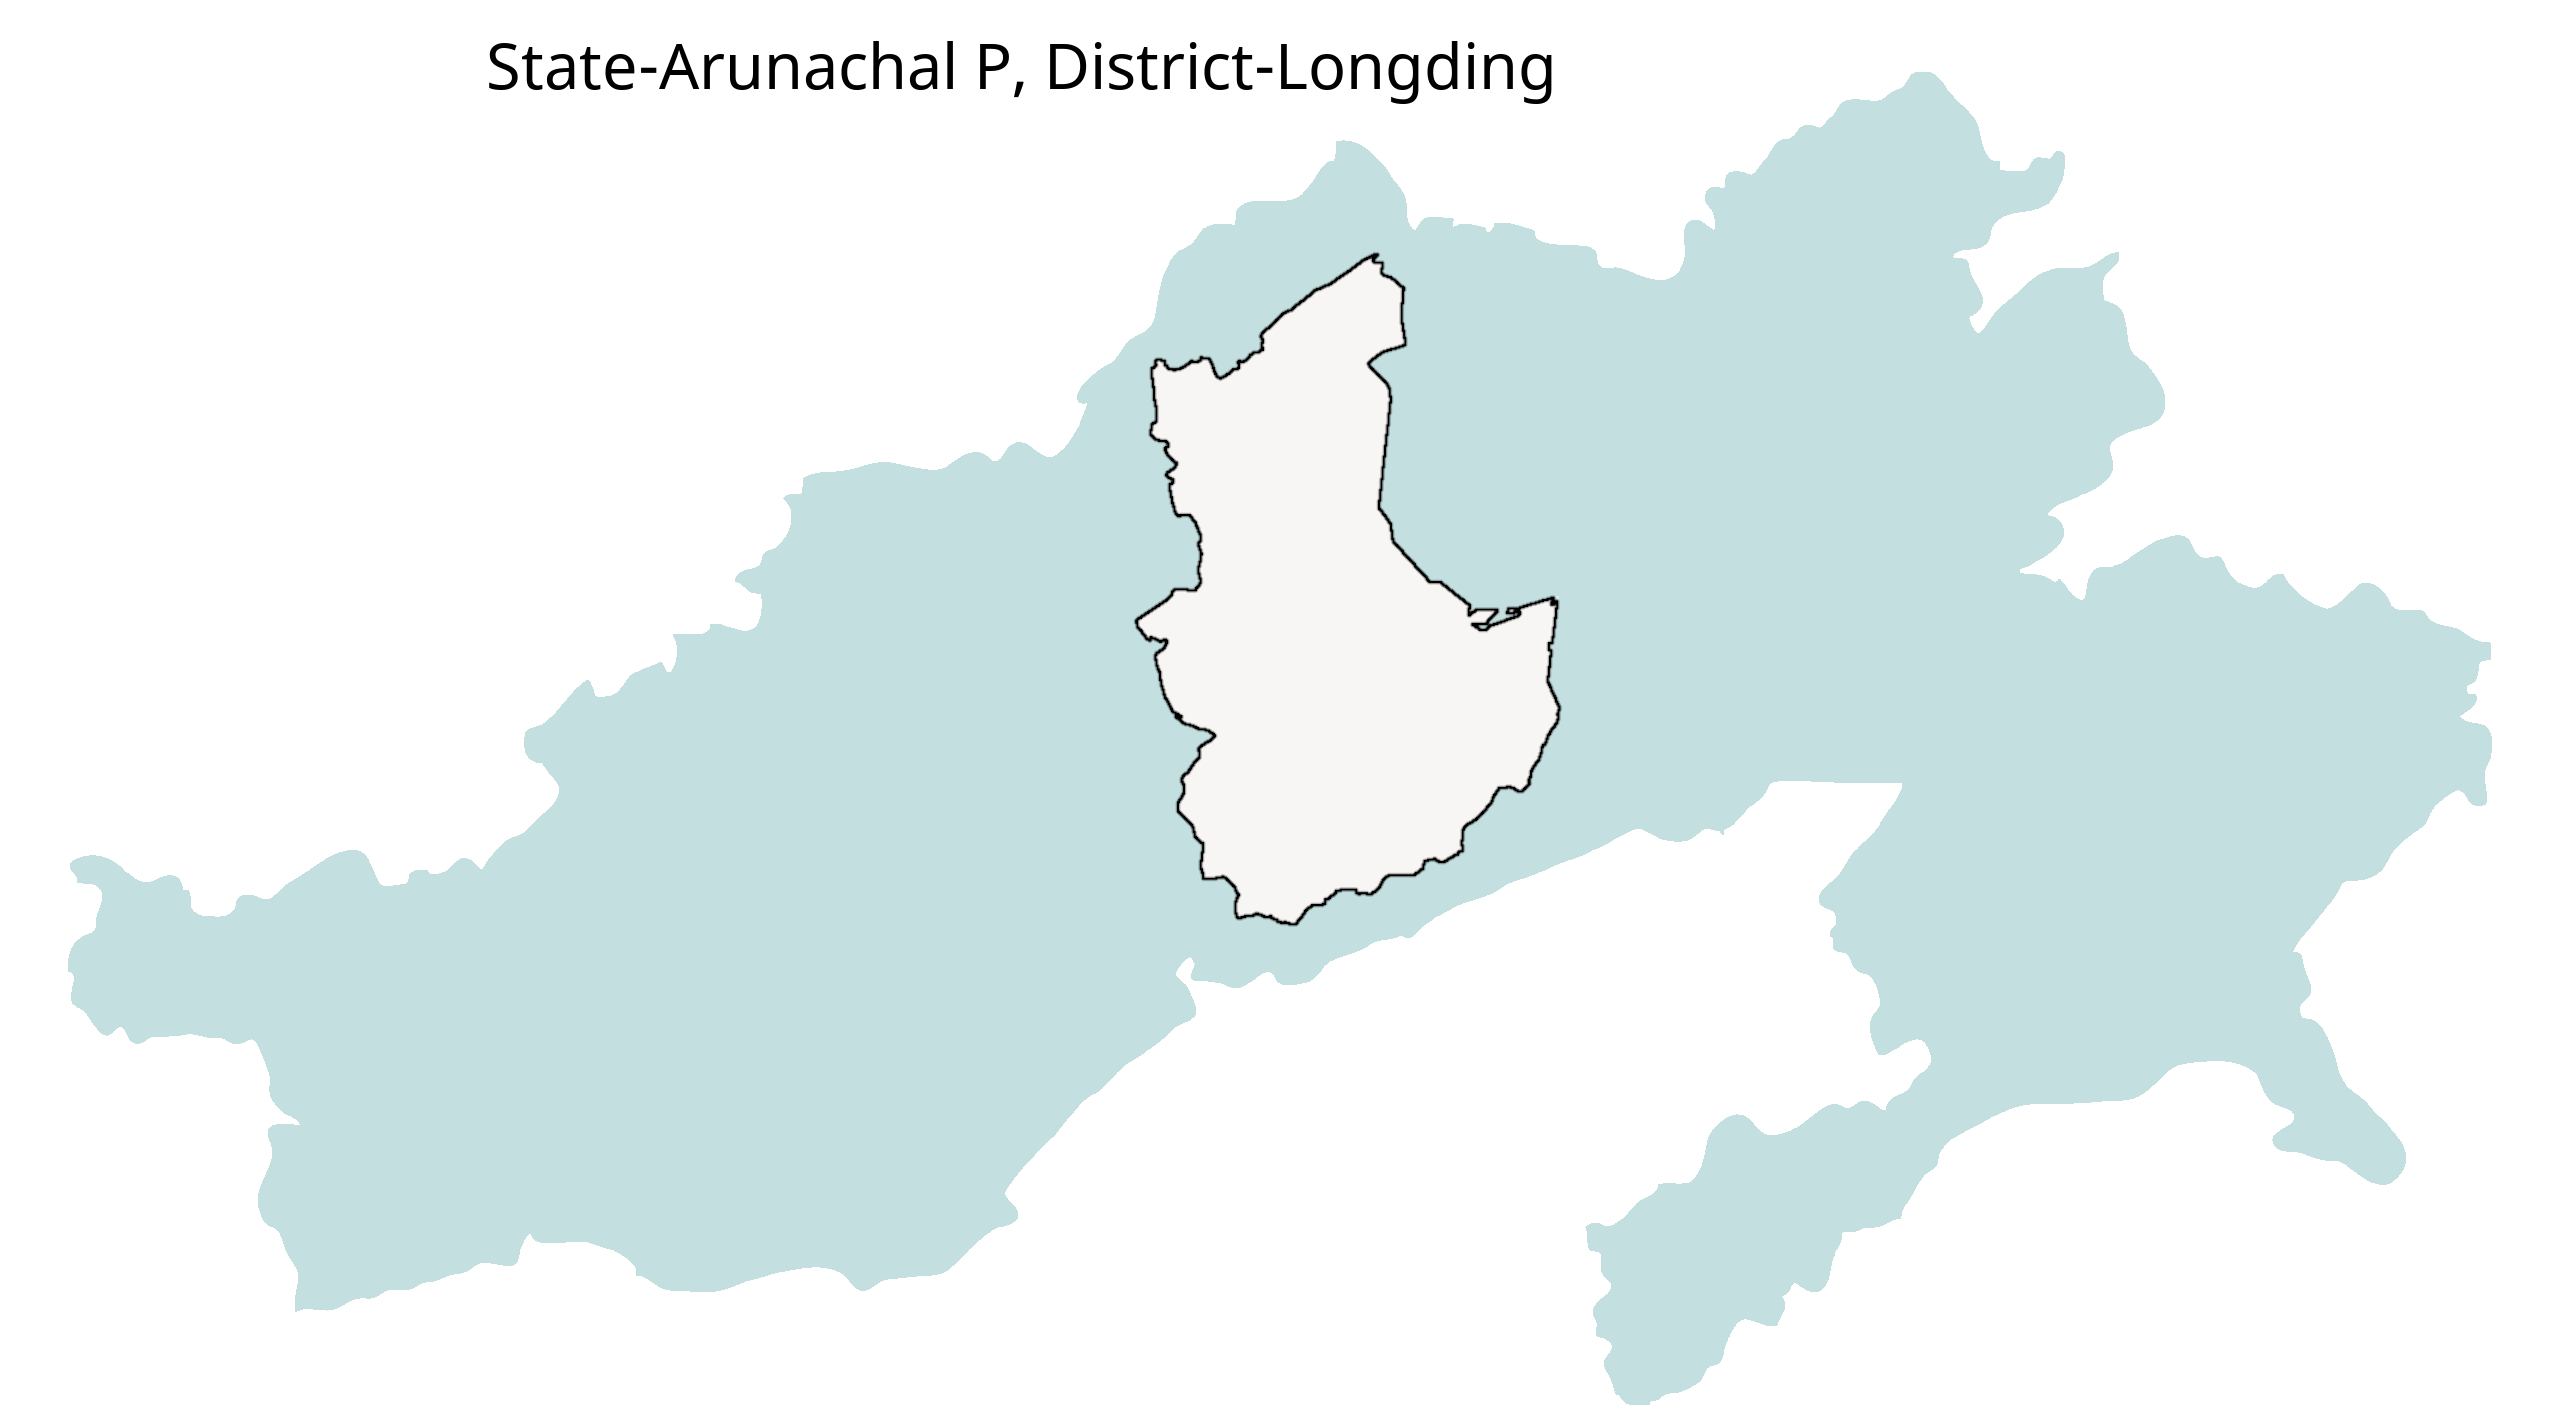
Longding city is the capital of Longding district, which has 2.7% of the State's population. In agriculture, this district contributes 3.8% of Arunachal Pradesh's Potatoes production, 3.8% of State's Banana production, and 3.8% of State's Onion production.
Longding is the 734th ranked city in population, out of 756 District Capitals (DHQs) of India. It is the capital of Longding District in Arunachal Pradesh State. Longding District is ranked 737th in population and 678th in area across India.
Longding is the 104th highest ranked in No. of Banks/1000 Household (in 1000, RBI SCB 2025) out of 756 city/districts of India. This indicates that banking infrastructure is stronger in this district compared to other districts.
Longding is the 123rd highest ranked in Gross Enrolment Ratio (GER) in Higher Education (18-23 Years) (No, AISHE 2021) out of 756 city/districts of India. This indicates that this district is more urbanized and/or has a better-developed educational infrastructure compared to other districts.
Out of 756 District Capitals/Districts of India, Longding is the 155th highest ranked in No of District Hospital . This indicates that health infrastructure in this district is better than other districts.
The average Crime/1000 Pop (Ratio, IPC 2024) of Indian city (district capitals)/districts is 2. Longding is the 271st highest ranked city out of 756 city/districts.This indicates a safer district as compared to other districts.
 No. of Banks/1000 Household (in 1000, RBI SCB 2025)
 Gross Enrolment Ratio (GER) in Higher Education (18-23 Years) (No, AISHE 2021)
 No of District Hospital
 Crime/1000 Pop (Ratio, IPC 2024)
 Murder/Lakh Pop (Ratio, IPC 2024)
 # of Total Enrolments (No, AISHE 2021)
 Bank Deposit/Household (Lakhs, RBI SCB 2025)
 # of Enrolment in Private and Government Colleges (No, AISHE 2021)
The Average Murder/Lakh Pop (Ratio, IPC 2024) of Indian City (District Capitals)/Districts is 2. Longding is the 52nd worst ranked City out of 756 City/Districts. This implies lesser effectiveness of law and order in this district compared to other districts.
The Average # of Total Enrolments (No, AISHE 2021) of Indian City (District Capitals)/Districts is 50309. Longding is the 712th worst ranked City out of 756 City/Districts. This indicates that this district is less urbanised and/or has a less developed educational infrastructure compared to other districts
The Average Bank Deposit/Household (Lakhs, RBI SCB 2025) of Indian City (District Capitals)/Districts is 14. Longding is the 639th worst ranked City out of 756 City/Districts. This implies that financial activities in this district are less compared to other districts.
The Average # of Enrolment in Private and Government Colleges (No, AISHE 2021) of Indian City (District Capitals)/Districts is 40299. Longding is the 514th worst ranked City out of 756 City/Districts. This implies that this district is less urbanised and/or has a less developed educational infrastructure compared to other districts
The Data-Ranks below are numbered from 1 to 756 for each metric. The Indian census data is aggregated and shared for 756 geographies by the government at a regular frequency. We have shared the data-rank below for easy relative comparison between the 756 Indian districts/state captials. However, we do have the actual numbers for each metric, and these are available for our registered users. To register, please click here.
Longding Nature Highlights
| Nature Metrics | % of India | Rank Out of 756 | City / Districts Data | |
|---|---|---|---|---|
|
Ab. Prod (000' tonnes) Banana Production |
Ab. Prod (000' tonnes) Banana Production | 0.02% | 19th | 9021 |
|
Ab. Prod (000' tonnes ) Potatoes Production |
Ab. Prod (000' tonnes ) Potatoes Production | 0.01% | 24th | 1788 |
|
Number of Goat (20th Cattle Census) |
Number of Goat (20th Cattle Census) | 0.00% | 44th | 3382 |
|
Ab. Prod (Lakh tonnes) Chickpea Production |
Ab. Prod (Lakh tonnes) Chickpea Production | 0.05% | 135th | 2384 |
|
Ab. Prod (000' Tonnes) Onion Production |
Ab. Prod (000' Tonnes) Onion Production | 0.02% | 177th | 3944 |
|
Number of Pig (20th Cattle Census) |
Number of Pig (20th Cattle Census) | 0.05% | 229th | 3280 |
|
Number of Cattle (20th Cattle Census) |
Number of Cattle (20th Cattle Census) | 0.00% | 338th | 11023 |
|
Number of Total Poultry (20th Cattle Census) |
Number of Total Poultry (20th Cattle Census) | 0.00% | 571st | 6609 |
The Data-Ranks below are numbered from 1 to 756 for each metric. The Indian census data is aggregated and shared for 756 geographies by the government at a regular frequency. We have shared the data-rank below for easy relative comparison between the 756 Indian districts/state captials. However, we do have the actual numbers for each metric, and these are available for our registered users. To register, please click here.
Longding Culture message.info.Highlights
| Sr.No | ai.info.Culture Metrics | ai.info.Counts | ai.info.Name |
|---|
The Data-Ranks below are numbered from 1 to 756 for each metric. The Indian census data is aggregated and shared for 756 geographies by the government at a regular frequency. We have shared the data-rank below for easy relative comparison between the 756 Indian districts/state captials. However, we do have the actual numbers for each metric, and these are available for our registered users. To register, please click here.
Better than India Average
| Sr.No | Fields | India Average | Rank out of 756 | City / District Data |
|---|---|---|---|---|
| 1 | No of District Hospital | 1 | 155th | 6839 |
Worse than India Average
| Sr.No | Fields | India Average | Worst Rank out of 756 | City / District Data |
|---|---|---|---|---|
| 1 | No of Hospital Beds | 1289 | 31st | 8925 |
| 2 | No of Primary Health Centers | 49 | 36th | 1940 |
| 3 | No of Total Hospitals | 62 | 46th | 3588 |
| 4 | No of Community Health Centers | 9 | 76th | 7692 |
| 5 | No of Doctors | 1825 | 82nd | 2663 |
| 6 | No of Nurses | 3442 | 98th | 2139 |
The Data-Ranks below are numbered from 1 to 756 for each metric. The Indian census data is aggregated and shared for 756 geographies by the government at a regular frequency. We have shared the data-rank below for easy relative comparison between the 756 Indian districts/state captials. However, we do have the actual numbers for each metric, and these are available for our registered users. To register, please click here.
Better than India Average
| Sr.No | Fields | India Average | Rank out of 756 | City / District Data |
|---|---|---|---|---|
| 1 | No. of Banks/1000 Household (in 1000, RBI SCB 2025) | 1 | 104th | 4564 |
| 2 | Bank Credit - Bank Debit/No. of banks (Crore, RBI SCB 2025) | 25 | 115th | 1234 |
Worse than India Average
| Sr.No | Fields | India Average | Worst Rank out of 756 | City / District Data |
|---|---|---|---|---|
| 1 | Number of Households with Internet (No, Census 2011) | 10793 | 23rd | 8642 |
| 2 | Number of Households with TV, Computer/Laptop, Telephone/mobile phone and Scooter/ Car (No, Census 2011) | 15914 | 25th | 2544 |
| 3 | Number of Households without Internet (No, Census 2011) | 21296 | 26th | 11209 |
| 4 | Number of Households with Mobile only (No, Census 2011) | 176769 | 27th | 9889 |
| 5 | Number of Banks (No, RBI SCB Q4 2025) | 202 | 27th | 3492 |
| 6 | GDP (Crores. RBI SCB 2025) | 45120 | 28th | 6886 |
| 7 | Number of Households with means of Transport as Scooter/ Motorcycle/Moped (No, Census 2011) | 70615 | 28th | 6415 |
| 8 | Number of Households with means of Transport as Car/ Jeep/Van (No, Census 2011) | 15804 | 28th | 2207 |
| 9 | Number of Households with Television (No, Census 2011) | 159851 | 28th | 6786 |
| 10 | Number of Households with Owned houses (No, Census 2011) | 284991 | 29th | 2807 |
| 11 | Bank Credit (Crore, RBI SCB Q4 2025) | 28696 | 36th | 6338 |
| 12 | Number of Households without TV, Internet, Radio, Computer, Mobile, Landline (No, Census 2011) | 57950 | 41st | 6136 |
| 13 | Number of Households with rented houses (No, Census 2011) | 38188 | 41st | 4971 |
| 14 | Bank Deposits (Crore, RBI SCB Q4 2025) | 35100 | 51st | 9758 |
| 15 | % of Household with Mobiles (%, Census 2011) | 50 | 129th | 3368 |
| 16 | House Ownership % of Households (%, Census 2011) | 87 | 164th | 2073 |
| 17 | Bank Deposit-Bank Loans (Crores, RBI SCB 2025) | 6492 | 243rd | 9451 |
| 18 | GDP per Capita ('000', RBI SCB 2025) | 260 | 454th | 3558 |
| 19 | % of Households with Cars (%, Census 2011) | 4 | 461st | 2051 |
| 20 | Bank Loans/Household (Lakhs, RBI SCB 2025) | 12 | 551st | 7839 |
| 21 | Bank Deposit/Household (Lakhs, RBI SCB 2025) | 14 | 639th | 8640 |
The Data-Ranks below are numbered from 1 to 756 for each metric. The Indian census data is aggregated and shared for 756 geographies by the government at a regular frequency. We have shared the data-rank below for easy relative comparison between the 756 Indian districts/state captials. However, we do have the actual numbers for each metric, and these are available for our registered users. To register, please click here.
Better than India Average
| Sr.No | Fields | India Average | Rank out of 756 | City / District Data |
|---|---|---|---|---|
| 1 | Dist. Formation Year | 2011 | 85th | 6367 |
Worse than India Average
| Sr.No | Fields | India Average | Worst Rank out of 756 | City / District Data |
|---|---|---|---|---|
| 1 | Population per sq. km. (Km, Census 2011) | 589 | 45th | 7485 |
| 2 | Decadal Growth Rate (2011) (%, Census 2011) | 19 | 169th | 4241 |
| 3 | Sex-Ratio (1000) (%, Census 2011) | 950 | 320th | 7498 |
The Data-Ranks below are numbered from 1 to 756 for each metric. The Indian census data is aggregated and shared for 756 geographies by the government at a regular frequency. We have shared the data-rank below for easy relative comparison between the 756 Indian districts/state captials. However, we do have the actual numbers for each metric, and these are available for our registered users. To register, please click here.
Better than India Average
| Sr.No | Fields | India Average | Rank out of 756 | City / District Data |
|---|---|---|---|---|
| 1 | Gross Enrolment Ratio (GER) in Higher Education (18-23 Years) (No, AISHE 2021) | 29 | 123rd | 1536 |
Worse than India Average
| Sr.No | Fields | India Average | Worst Rank out of 756 | City / District Data |
|---|---|---|---|---|
| 1 | # of Colleges (No, AISHE 2021) | 58 | 17th | 5713 |
| 2 | # of No. of Schools (No, UDISE 2023) | 1950 | 45th | 5390 |
| 3 | # of Ph.D Enrolments (No, AISHE 2021) | 275 | 78th | 1713 |
| 4 | # of UG Enrolments - Law (No, AISHE 2021) | 613 | 175th | 6079 |
| 5 | # of UG Enrolments - Medical (No, AISHE 2021) | 459 | 179th | 4793 |
| 6 | # of Master's Enrolment (No, AISHE 2021) | 6932 | 210th | 5957 |
| 7 | # of Population (0-18) (No, Census 2011) | 139111 | 254th | 3060 |
| 8 | # of UG Enrolments - Arts (No, AISHE 2021) | 12846 | 311th | 9195 |
| 9 | # of ITIS seats (No, AISHE 2021) | 4405 | 344th | 2969 |
| 10 | # of UG Diploma Enrolments (No, AISHE 2021) | 342 | 348th | 2693 |
| 11 | # of Higher Education Enrolments % of Pop (No, UDISE 2023) | 2 | 354th | 4276 |
| 12 | Population (18-24) (Number, 2023) | 222087 | 386th | 10703 |
| 13 | # of PG Enrolments - Arts (No, AISHE 2021) | 1619 | 390th | 4895 |
| 14 | # of UG Enrolments - Teaching (No, AISHE 2021) | 1969 | 443rd | 7072 |
| 15 | # of Diploma (No, AISHE 2021) | 3736 | 507th | 1658 |
| 16 | # of Enrolment in Private and Government Colleges (No, AISHE 2021) | 40299 | 514th | 9424 |
| 17 | # of Bachelor's Enrolment (No, AISHE 2021) | 45972 | 661st | 3352 |
| 18 | # of Total Enrolments (No, AISHE 2021) | 50309 | 712th | 4462 |
The Data-Ranks below are numbered from 1 to 756 for each metric. The Indian census data is aggregated and shared for 756 geographies by the government at a regular frequency. We have shared the data-rank below for easy relative comparison between the 756 Indian districts/state captials. However, we do have the actual numbers for each metric, and these are available for our registered users. To register, please click here.
Better than India Average
| Sr.No | Fields | India Average | Rank out of 756 | City / District Data |
|---|---|---|---|---|
| 1 | Murder/Lakh Pop (Ratio, IPC 2024) | 2 | 52nd | 6990 |
Worse than India Average
| Sr.No | Fields | India Average | Worst Rank out of 756 | City / District Data |
|---|---|---|---|---|
| 1 | Sanctioned Police Force Number (NO, IPC 2024) | 3647 | 28th | 8996 |
| 2 | Number of Panchayats (Number , Census 2011) | 781 | 40th | 4566 |
| 3 | Number of Police Stations (NO, IPC 2024) | 24 | 47th | 2162 |
| 4 | Number of IPC Crimes (NO, IPC 2024) | 4796 | 56th | 4300 |
| 5 | Number of Murders (NO, IPC 2024) | 37 | 64th | 5720 |
| 6 | Crime/1000 Pop (Ratio, IPC 2024) | 2 | 271st | 1674 |
The Data-Ranks below are numbered from 1 to 756 for each metric. The Indian census data is aggregated and shared for 756 geographies by the government at a regular frequency. We have shared the data-rank below for easy relative comparison between the 756 Indian districts/state captials. However, we do have the actual numbers for each metric, and these are available for our registered users. To register, please click here.
Worse than India Average
| Sr.No | Fields | India Average | Worst Rank out of 756 | City / District Data |
|---|---|---|---|---|
| 1 | Number of Internet Connections (No, TRAI March 2026) | 600102 | 26th | 8311 |
| 2 | English Speakers (Second Language + Third Language (No, Census 2011) | 165561 | 59th | 1457 |
| 3 | Linkedin Audience Size(No, Linkedin April, 2026) | 201256 | 62nd | 7282 |
| 4 | Number of Instagram Users. (Estimated Minimum) | 347714 | 99th | 7539 |
| 5 | Urban Internet Pop/City Pop(%, TRAI March 2026) | 136 | 263rd | 10825 |
The Data-Ranks below are numbered from 1 to 756 for each metric. The Indian census data is aggregated and shared for 756 geographies by the government at a regular frequency. We have shared the data-rank below for easy relative comparison between the 756 Indian districts/state captials. However, we do have the actual numbers for each metric, and these are available for our registered users. To register, please click here.
Worse than India Average
| Sr.No | Fields | India Average | Worst Rank out of 756 | City / District Data |
|---|---|---|---|---|
| 1 | DHQ Mother Tongue Population (No, Census 2011) | 262810 | 33rd | 2627 |
| 2 | English Multilingual Population | 68182 | 62nd | 5625 |
| 3 | Odia Script | 5834 | 130th | 2577 |
| 4 | Malayalam Script | 21493 | 212th | 5851 |
| 5 | Devnagri Script (Hindi) | 141580 | 215th | 6219 |
| 6 | Telugu Script | 30635 | 223rd | 4136 |
| 7 | Literacy (%, Census 2023)Estd | 78 | 228th | 10702 |
| 8 | Kannada Script | 16891 | 307th | 4197 |
| 9 | Bengali Script | 21989 | 444th | 8899 |
| 10 | Assamese Script | 4262 | 571st | 5355 |
| 11 | Latin Script (English) | 2269 | 586th | 5048 |
The Data-Ranks below are numbered from 1 to 756 for each metric. The Indian census data is aggregated and shared for 756 geographies by the government at a regular frequency. We have shared the data-rank below for easy relative comparison between the 756 Indian districts/state captials. However, we do have the actual numbers for each metric, and these are available for our registered users. To register, please click here.
Worse than India Average
| Sr.No | Fields | India Average | Worst Rank out of 756 | City / District Data |
|---|---|---|---|---|
| 1 | Number of Dailies or Magazines (No, RNI 2022) | 245 | 11th | 3936 |
| 2 | Total Annual Newspaper Circulation (No, RNI 2022) | 670794 | 43rd | 3047 |
The Data-Ranks below are numbered from 1 to 756 for each metric. The Indian census data is aggregated and shared for 756 geographies by the government at a regular frequency. We have shared the data-rank below for easy relative comparison between the 756 Indian districts/state captials. However, we do have the actual numbers for each metric, and these are available for our registered users. To register, please click here.
Worse than India Average
| Sr.No | Fields | India Average | Worst Rank out of 756 | City / District Data |
|---|---|---|---|---|
| 1 | # of Households with 1 married couple | 232072 | 28th | 8512 |
| 2 | Number of households (Number , Census 2011) | 331150 | 29th | 2402 |
| 3 | # of Households with Location of drinking water source within premises | 156578 | 30th | 9981 |
| 4 | # of Households that use LPG/PNG as fuel for Cooking | 97776 | 33rd | 2884 |
| 5 | # of Households with Main source of Lighting as Electricity | 226023 | 33rd | 4677 |
| 6 | # of Inhabited Villages | 783 | 36th | 7161 |
| 7 | Number of households having latrine facility within the premises | 159246 | 38th | 2831 |
| 8 | Number of towns (Number , Census 2011) | 11 | 50th | 8250 |
| 9 | Urban Population (Number , Census 2011) | 539511 | 58th | 5162 |
| 10 | # of Households with Main source of Lighting as Solar Energy | 1514 | 64th | 2817 |
| 11 | Urbanization (% , Census 2011) | 27 | 152nd | 8213 |
The Data-Ranks below are numbered from 1 to 756 for each metric. The Indian census data is aggregated and shared for 756 geographies by the government at a regular frequency. We have shared the data-rank below for easy relative comparison between the 756 Indian districts/state captials. However, we do have the actual numbers for each metric, and these are available for our registered users. To register, please click here.
Worse than India Average
| Sr.No | Fields | India Average | Worst Rank out of 756 | City / District Data |
|---|---|---|---|---|
| 1 | Informal Jobs(DHQ),2023 | 75949 | 29th | 9901 |
| 2 | Informal Jobs(Dist.),2023 | 640794 | 30th | 6552 |
| 3 | Formal Jobs(Dist.),2023 | 21364 | 30th | 7621 |
| 4 | # of Companies,2023 | 1934 | 31st | 9589 |
| 5 | State Govt Jobs(Formal) Dist.,2023 | 2089 | 36th | 10758 |
| 6 | Formal Jobs(DHQ),2023 | 19463 | 52nd | 3278 |
| 7 | State Govt Jobs(Formal) DHQ,2023 | 14287 | 59th | 5362 |
LANGUAGES
City (District Capitals)/DHQ
Number Of Languages spoken by more then 30K Population : 0
BASIC DETAILS
| City (District Capitals)/DHQ
Population : |
: | 4,234 |
|---|---|---|
| City (District Capitals)/DHQ Population (Rank) |
: | 734th |
| District Area (km2) |
: | 1,200 |
| District Area (Rank) |
: | 678th |
| No.of Towns
in District |
: | 1 |
| No. of Villages
in District |
: | 14 |
Q - Why is all Prarang India comparative analysis being done for 756 Districts & their
respective
D.H.Q. (District Head Quarter) towns?
A - The Indian geography has historically been measured by " Districts". Today, it is
politically
managed by States & U.T.s ( Union Territories) but the unit of measurement ( Census
baseline)
continues to focus on the District, for over 150 years now. " All India" thus is a sum of the
district
parts i.e. sum of 756 districts currently ( which were 640 districts only, when the last Census
took
place in 2011). Contrary to popular perception, most data being reported at a State & U.T.
level, is
not being aggregated from underlying data at an urban (towns) & rural(villages) level. India
has
approx. 9000 towns & 600000 villages, segregated into 756 districts, each with its
respective
DHQ
(District Head Quarter) town. Except for the largest 20 towns ( Metropolitan agglomerations)
where
some detailed data is gathered by the Central Government census, only basic demographic details
are available for India's cities. Detailed survey results of the District are the most important
data
points, used to model & estimate the City & State level information in India. The 756
DHQ (
District
Head Quarter) towns & 8 Union Territories, are the important Urban metrics available in
India,
for
comparative analysis. Big data of a big & diverse country.