Analytics: World
Analytics: World
Date: July 28, 2026
 Brazil is a large country with 2.7% of the world's population. Brazil is a democratic, republic country. It has 24 world heritage sites. It is home to 8% Christians of the world. It produces 1.4% Rice, 1.3% Wheat, 1.1% Potatoes, 34.3% Soyabean, and 1.5% Onions of the world. It is rich in resources and has 4.3% Oil, 1.2% Fluorite, 8% Bauxite, 1.7% Lithium, 3.2% Nickel, and 5.7% Tin of the world.
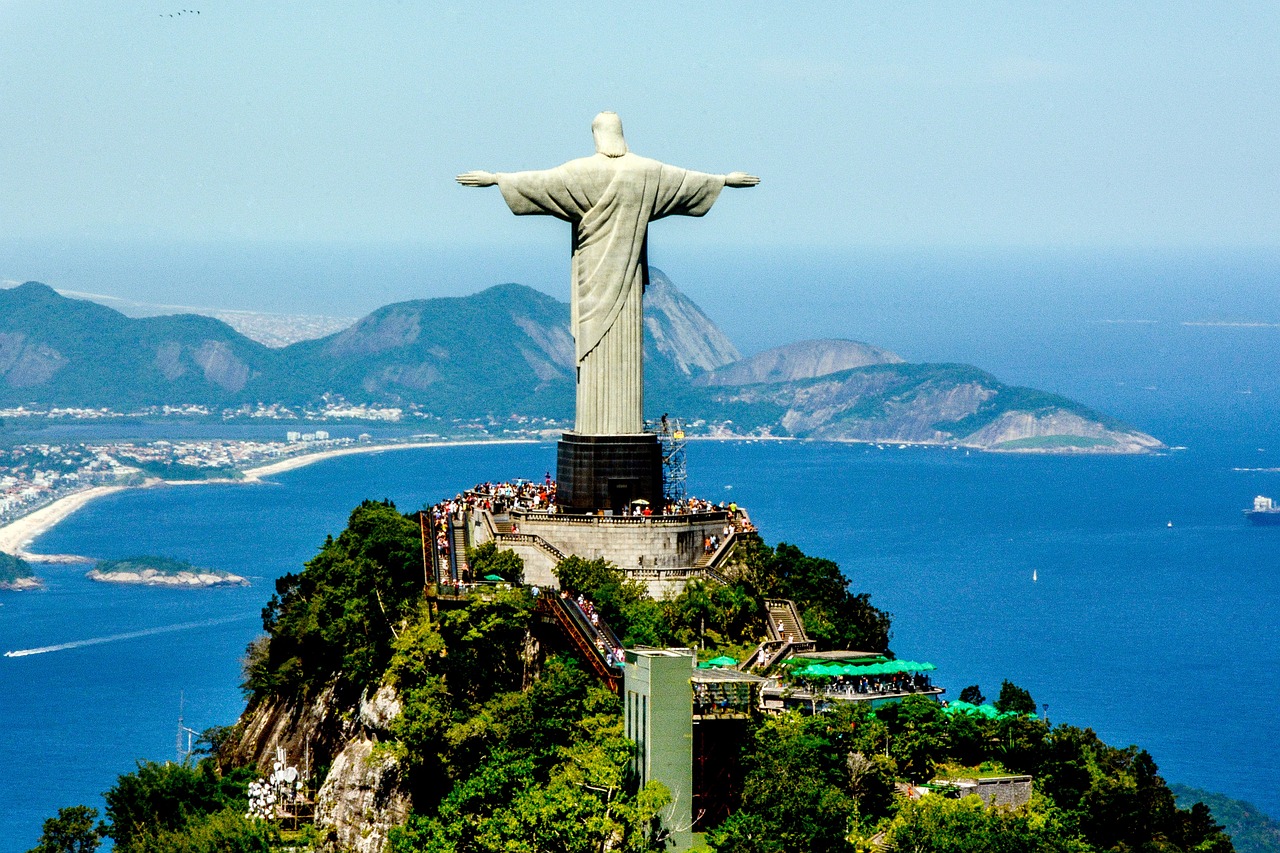
Brazil is the 7th ranked country in population and 5th ranked in area out of 195 countries in the world. Please keep the country rank in perspective, for the highlights below.
 Sugarcane prod.
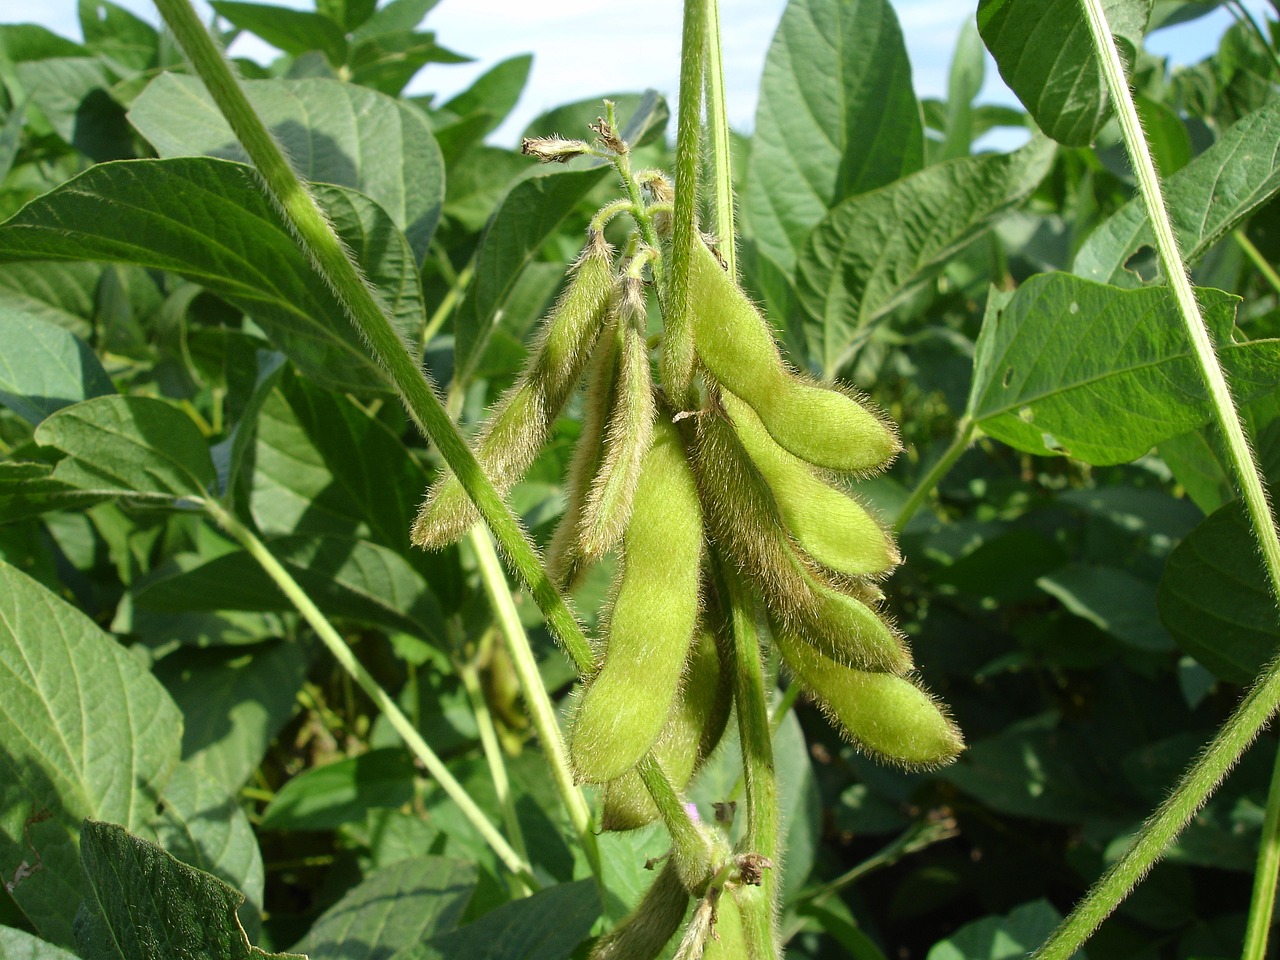 Soyabean prod.
 Facebook users
 Enrolment in tertiary edu.(all programmes)
Out of 195 countries in the world, Brazil is the 1st highest ranked in Sugarcane prod. . This is indicative of a more fertile land, suitable for producing high quantities of sugarcane, or the country being a large exporter of sugar as compared to other countries.
The Average Soyabean prod. of 195 countries in the world is 3,572,369. Brazil is the 1st highest ranked country out of 195 countries. This is indicative of a more fertile land, suitable for producing high quantities of soyabean when compared to other countries.
The Average Facebook users of 195 countries in the world is 11,706,915. Brazil is the 4th highest ranked country out of 195 countries. This may take into context a higher country population, or may simply imply that this country has more social media popularity, or may have a higher youth demographic.
Brazil is the 4th highest ranked in Enrolment in tertiary edu.(all programmes) out of all the 195 countries.This may take into context a higher country population, or imply that more people in this country pursue higher education when compared to other countries.
 GDP Per Capita (USD)
 Barley prod.
 Natural Gas Prod.
 Sweet Potatoes prod.
The Average GDP Per Capita (USD) of 195 countries in the world is 18,044. Brazil is the 117th worst ranked country out of 195 countries. This implies that this country is a developing country.
Out of 195 countries in the world, Brazil is the 158th worst ranked in Barley prod. . This is indicative of less focus on the production of barley, or scarcity of fertile land, or higher industrialisation as compared to other countries.
The Average Natural Gas Prod. of 195 countries in the world is 43,738. Brazil is the 166th worst ranked country out of 195 countries. This indicates that natural resources are scarce in this country when compared to other countries, and it may be a huge importer of such resources.
Brazil is the 181st worst ranked in Sweet Potatoes prod. out of all the 195 countries.This is indicative of less focus on the production of sweet potatoes, or scarcity of fertile land, or higher industrialisation as compared to other countries.
| Sr. | Title | Metric | World Average | Rank out of 195 | Value | ||
|---|---|---|---|---|---|---|---|
|
Above World Average |
|||||||
| 1 | Portuguese | # People | 14,438,442 | 1 | 1130 | ||
| 2 | Portuguese as a % of total Portuguese speakers | % People | 0 | 1 | 1128 | ||
| 3 | Ashaninka as a % of total Ashaninka speakers | % People | 0 | 2 | 1126 | ||
| 4 | Quechua as a % of total Quechua speakers | % People | 0 | 4 | 1130 | ||
| 5 | Italian as a % of total Italian speakers | % People | 0 | 5 | 1128 | ||
| 6 | German as a % of total German speakers | % People | 0 | 6 | 1127 | ||
|
Below World Average |
|||||||
| 1 | German | # People | 5,121,263 | 6 | 1235 | ||
| 2 | Italian | # People | 4,106,100 | 5 | 1233 | ||
| 3 | Quechua | # People | 1,218,571 | 4 | 1233 | ||
| 4 | Japanese | # People | 41,499,666 | 3 | 1235 | ||
| 5 | Japanese as a % of total Japanese speakers | % People | 0 | 3 | 1234 | ||
| Sr. | Title | Metric | World Average | Rank out of 195 | Value | ||
|---|---|---|---|---|---|---|---|
|
Above World Average |
|||||||
| 1 | Pop. with access to Electricity (%) | % People | 86 | 1 | 1126 | ||
| 2 | # Cities>100000 | # Cities | 21 | 2 | 1125 | ||
| 3 | # Cities>10M | # Cities | 0 | 2 | 1125 | ||
| 4 | # Cities>100000 | # Cities | 27 | 3 | 1125 | ||
| 5 | # Cities>300000 | # Cities | 11 | 3 | 1129 | ||
| 6 | # Cities>500000 | # Cities | 7 | 3 | 1128 | ||
| 7 | # Cities>1M | # Cities | 4 | 3 | 1126 | ||
| 8 | # Cities>5M | # Cities | 1 | 3 | 1129 | ||
| 9 | # Cities>300000 | # Cities | 7 | 3 | 1126 | ||
| 10 | # Cities>500000 | # Cities | 4 | 3 | 1126 | ||
| 11 | # Cities>5M | # Cities | 0 | 3 | 1125 | ||
| 12 | Urban Population (2021) | # People | 23,603,754 | 4 | 1125 | ||
| 13 | # Cities>1M | # Cities | 1 | 4 | 1127 | ||
| 14 | Rural Pop. | # People | 18,013,759 | 22 | 1127 | ||
| 15 | Urban Population / Total Population % . | % People | 60 | 25 | 1129 | ||
|
Below World Average |
|||||||
| 1 | Rural Pop. /Total Pop. % | % People | 40 | 171 | 1231 | ||
| 2 | # Cities>10M | # Cities | 1 | 4 | 1235 | ||
| Sr. | Title | Metric | World Average | Rank out of 195 | Value | ||
|---|---|---|---|---|---|---|---|
|
Above World Average |
|||||||
| 1 | Sugarcane prod. | Tons | 20,929,075 | 1 | 1128 | ||
| 2 | Soyabean prod. | Tons | 3,572,369 | 1 | 1127 | ||
| 3 | Sugarcane Produced/Total Sugarcane Produced.% | Weight | 2 | 1 | 1130 | ||
| 4 | Soyabean Produced/Total Soyabean Produced % | Weight | 1 | 1 | 1130 | ||
| 5 | Number of Cows | Count | 8,697,624 | 1 | 1130 | ||
| 6 | Cow Beef Production (in tonnes) | Weight | 320,761 | 1 | 1126 | ||
| 7 | Orange Production (in tonnes) | Weight | 618,959 | 1 | 1126 | ||
| 8 | Cows (% of Total Cows) | Percent | 0 | 1 | 1129 | ||
| 9 | Cow Beef Production (% of Total Cow Beef Production) | Percent | 0 | 1 | 1128 | ||
| 10 | Orange Production (% of Total Orange Production) | Percent | 0 | 1 | 1127 | ||
| 11 | Forest Area. | Area | 21,595,147 | 2 | 1129 | ||
| 12 | Country forest area / Global Forest area % | 0 | 2 | 1127 | |||
| 13 | Chicken Meat Production (in tonnes) | Weight | 588,164 | 2 | 1126 | ||
| 14 | Iron Production (in 1000 metric tons) | Weight | 33,258 | 2 | 1128 | ||
| 15 | Chicken Meat Production (% of Total Chicken Meat Production) | Percent | 0 | 2 | 1128 | ||
| 16 | Iron Production (% of Total Iron Production) | Percent | 2 | 2 | 1126 | ||
| 17 | Cow Milk Production (in tonnes) | Weight | 3,855,383 | 3 | 1125 | ||
| 18 | Cotton Production (in 1000 480 lb. Bales) | Weight | 1,707 | 3 | 1125 | ||
| 19 | Cow Milk Production (% of Total Cow Milk Production) | Percent | 0 | 3 | 1128 | ||
| 20 | Cotton Production (% of Total Cotton Production) | Percent | 1 | 3 | 1130 | ||
| 21 | Bauxite prod. | Tons | 29,969 | 4 | 1128 | ||
| 22 | Bauxite Produced/Total Bauxite Produced % | Weight | 7 | 4 | 1128 | ||
| 23 | Oil Prod. | Barrels/day | 855,887 | 8 | 1129 | ||
| 24 | Honey prod. | Tons | 15,393 | 10 | 1127 | ||
| 25 | Honey Produced /Total Honey Produced % | Weight | 0 | 10 | 1126 | ||
| 26 | Rice prod. | Tons | 6,920,442 | 11 | 1125 | ||
| 27 | Onion prod. | Tons | 819,042 | 11 | 1125 | ||
| 28 | Rice Produced/Total Rice Produced.% | Weight | 0 | 11 | 1128 | ||
| 29 | Onion Produced/Total Onion Produced % | Weight | 0 | 11 | 1129 | ||
| 30 | Apple Production (in tonnes) | Weight | 1,044,287 | 13 | 1128 | ||
| 31 | Apple Production (% of Total Apple Production) | Percent | 1 | 13 | 1126 | ||
| 32 | Goat Milk Production (in tonnes) | Weight | 196,989 | 16 | 1129 | ||
| 33 | Goat Milk Production (% of Total Goat Milk Production) | Percent | 0 | 16 | 1130 | ||
| 34 | Wheat prod. | Tons | 6,811,171 | 17 | 1127 | ||
| 35 | Wheat Produced /Total Wheat Produced. %. | Weight | 0 | 17 | 1125 | ||
| 36 | Potatoes prod. | Tons | 2,504,846 | 18 | 1126 | ||
| 37 | Potatoes Produced /Total Potatoes Produced % | Weight | 0 | 18 | 1130 | ||
| 38 | Tree density . | Density | 828 | 27 | 1125 | ||
| 39 | Tree density. | Density | 22,685 | 58 | 1125 | ||
| 40 | Number of Trees | Count | 15,642,617,148 | 96 | 1127 | ||
|
Below World Average |
|||||||
| 1 | Nickel Produced/Total Nickel Produced % | Weight | 14 | 7 | 1233 | ||
| 2 | Lithium Produced/Total Lithium Produced % | Weight | 12 | 5 | 1235 | ||
| 3 | Gold Produced/Total Gold Produced %. | 4 | 14 | 1235 | |||
| 4 | Uranium Produced/Total Uranium Produced % | Weight | 5 | 13 | 1235 | ||
| 5 | Tin Produced/Total Tin Produced in 2019 | Weight | 7 | 5 | 1233 | ||
| 6 | Flourite Produced/Total Flourite Produced % | Weight | 4 | 10 | 1232 | ||
| 7 | Natural Gas Produced/Total Natural Gas Produced % | Mass | 5 | 29 | 1230 | ||
| 8 | Oil Prodcuced/Total Oil Produced % | 5 | 8 | 1232 | |||
| 9 | Barley Produced/Total Barley Produced.% | Weight | 1 | 37 | 1231 | ||
| 10 | Barley prod. | Tons | 1,545,003 | 38 | 1235 | ||
| 11 | Natural Gas Prod. | Million cubic meters | 43,738 | 29 | 1234 | ||
| 12 | Coal Production (% of Total Coal Production) | Percent | 1 | 28 | 1234 | ||
| 13 | Coal Production (in 1000 metric tons) | Weight | 121,850 | 28 | 1235 | ||
| 14 | Goat Meat Production (in tonnes) | Weight | 46,111 | 21 | 1230 | ||
| 15 | Goat Meat Production (% of Total Goat Meat Production) | Percent | 0 | 20 | 1235 | ||
| 16 | Gold Prod. | Weight | 125 | 14 | 1231 | ||
| 17 | Sweet Potatoes prod. | Tons | 878,129 | 15 | 1233 | ||
| 18 | Sweet Potatoes Produced/Total Sweet Potatoes Produced % | Weight | 0 | 15 | 1230 | ||
| 19 | Uranium prod. | Tons | 3,187 | 13 | 1234 | ||
| 20 | Flourite prod. | Tons | 231,501 | 10 | 1230 | ||
| 21 | Nickel prod. | Tons | 376,142 | 7 | 1230 | ||
| 22 | Tin prod. | Tons | 23,069 | 5 | 1234 | ||
| 23 | Lithium prod. | Tons | 16,162 | 5 | 1234 | ||
| Sr. | Title | Metric | World Average | Rank out of 195 | Value | ||
|---|---|---|---|---|---|---|---|
|
Above World Average |
|||||||
| 1 | # FIFA World Cup Championships | 2 | 1 | 1125 | |||
| 2 | Share of FIFA World Cup Championships (% World) | 12 | 1 | 1130 | |||
| 3 | Christian Population | # People | 16,917,912 | 2 | 1127 | ||
| 4 | Christian Pop./Total Christian Pop.% | % People | 0 | 2 | 1126 | ||
| 5 | # FIFA World Cup Third-Place Finishes | 1 | 2 | 1127 | |||
| 6 | # FIFA World Cup Finalist Appearances | 3 | 2 | 1129 | |||
| 7 | Silver Medal | Count | 5 | 10 | 1125 | ||
| 8 | Bronze Medal | Count | 5 | 10 | 1130 | ||
| 9 | Jewish Pop./Total Jewish Pop. % | % People | 0 | 10 | 1125 | ||
| 10 | Total Medals | Count | 12 | 12 | 1129 | ||
| 11 | World Heritage Sites | Count | 7 | 13 | 1130 | ||
| 12 | # Olympic Medals | Count | 146 | 27 | 1128 | ||
| 13 | Christian Pop./Total Pop.% | % People | 42 | 40 | 1125 | ||
|
Below World Average |
|||||||
| 1 | Islamic Pop./Total Pop.% | % People | 22 | 151 | 1234 | ||
| 2 | Islamic Pop./Total Islamic Pop.% | % People | 0 | 82 | 1232 | ||
| 3 | Islamic Population | # People | 10,091,996 | 87 | 1230 | ||
| 4 | Jewish Pop./Total Pop.% | % People | 0 | 36 | 1235 | ||
| 5 | # Cannes Grand Prizes (Palme d'Or or Grand Prix) | 4 | 16 | 1233 | |||
| 6 | Share of Cannes Grand Prize Wins (% World) | 3 | 16 | 1230 | |||
| 7 | Gold Medal | Count | 5 | 20 | 1233 | ||
| 8 | # Oscar Wins – Best International Feature Film | 2 | 16 | 1231 | |||
| 9 | Share of Best International Feature Film Wins (% World) | 3 | 16 | 1232 | |||
| 10 | Jewish Population | # People | 162,421 | 10 | 1232 | ||
| 11 | # FIFA World Cup Runners-Up | 2 | 4 | 1232 | |||
| Sr. | Title | Metric | World Average | Rank out of 195 | Value | ||
|---|---|---|---|---|---|---|---|
|
Above World Average |
|||||||
| 1 | FDI (millions USD) | Amount | 3,288 | 3 | 1128 | ||
| 2 | FDI / Total FDI of the World %. | 0 | 4 | 1129 | |||
| 3 | INDs for Business (%) | % People | 25 | 8 | 1130 | ||
| 4 | Corporate Tax Rates in % | Rate | 23 | 9 | 1130 | ||
| 5 | GDP (Billions USD) | $ Billions | 600 | 10 | 1128 | ||
| 6 | GDP as a % of Total GDP | Percent | 0 | 10 | 1126 | ||
| 7 | Import Ban(Number of products) | Count | 12 | 14 | 1129 | ||
| 8 | Export of Goods and Services (in Million $) | Amount | 180,704 | 22 | 1128 | ||
| 9 | Imports/Total Imports of the World %. | 0 | 22 | 1128 | |||
| 10 | Import of Goods and Services (in Million $) | Amount | 173,515 | 23 | 1127 | ||
| 11 | Exports /Total Exports of the World %. | 0 | 23 | 1126 | |||
| 12 | FTAs in India via Bengaluru (%) | % People | 6 | 24 | 1125 | ||
| 13 | FTAs in India for Business (%) | % People | 18 | 28 | 1127 | ||
| 14 | INDs via Ahmedabad Airport (%) | % People | 1 | 33 | 1127 | ||
| 15 | INDs via Chennai Airport (%) | % People | 5 | 36 | 1128 | ||
| 16 | INDs via Hyderabad Airport (%) | % People | 3 | 46 | 1129 | ||
| 17 | INDs via Bengaluru Airport (%) | % People | 5 | 47 | 1126 | ||
| 18 | INDs via Mumbai Airport (%) | % People | 33 | 54 | 1130 | ||
| 19 | FTAs in India for Leisure (%) | % People | 42 | 67 | 1128 | ||
| 20 | FTAs in India via Delhi (%) | % People | 46 | 75 | 1130 | ||
|
Below World Average |
|||||||
| 1 | INDs - Indian Diaspora (%) | % People | 22 | 154 | 1233 | ||
| 2 | Imports /Total GDP of the Country %. | 51 | 156 | 1235 | |||
| 3 | INDs for Leisure (%) | % People | 46 | 142 | 1232 | ||
| 4 | Exports/Total GDP of the Country %. | 48 | 147 | 1230 | |||
| 5 | FTAs in India - Indian Diaspora (%) | % People | 14 | 116 | 1234 | ||
| 6 | INDs via Delhi Airport (%) | % People | 38 | 139 | 1235 | ||
| 7 | FTAs in India for Education (%) | % People | 5 | 82 | 1232 | ||
| 8 | FTAs in India via Mumbai (%) | % People | 23 | 105 | 1234 | ||
| 9 | INDs via Trivandrum Airport (%) | % People | 1 | 44 | 1232 | ||
| 10 | INDs via Kolkata Airport (%) | % People | 2 | 54 | 1231 | ||
| 11 | FTAs in India via Chennai (%) | % People | 5 | 69 | 1231 | ||
| 12 | FTAs in India via Kolkata (%) | % People | 2 | 43 | 1235 | ||
| 13 | INDs via Cochin Airport (%) | % People | 3 | 58 | 1232 | ||
| 14 | GDP Per Capita at PPP (USD) | $ | 30,199 | 83 | 1232 | ||
| 15 | GDP Per Capita (USD) | $ | 18,044 | 79 | 1231 | ||
| 16 | FTAs in India via Cochin (%) | % People | 3 | 54 | 1234 | ||
| 17 | FTAs in India via Hyderabad (%) | % People | 3 | 44 | 1230 | ||
| 18 | INDs from India | # People | 158,494 | 68 | 1234 | ||
| 19 | FTAs in India | # People | 51,254 | 48 | 1234 | ||
| 20 | No. of Companies Listed in NYSE | Count | 65 | 5 | 1234 | ||
| Sr. | Title | Metric | World Average | Rank out of 195 | Value | ||
|---|---|---|---|---|---|---|---|
|
Above World Average |
|||||||
| 1 | Lawyers Per 100K | People Per 100K | 137 | 3 | 1130 | ||
| 2 | Total Military Force | # People | 362,682 | 8 | 1130 | ||
| 3 | Military Force/Total World Military Force %. | % People | 0 | 8 | 1128 | ||
| 4 | Police Officers | # People | 138,224 | 9 | 1128 | ||
| 5 | Military Budget (in Billion $) | $ Billion | 17 | 20 | 1129 | ||
| 6 | Military Budget/Total World Military Budget %. | Percent | 0 | 20 | 1129 | ||
|
Below World Average |
|||||||
| 1 | Military Force/Total Pop. % | % People | 1 | 53 | 1235 | ||
| Sr. | Title | Metric | World Average | Rank out of 195 | Value | ||
|---|---|---|---|---|---|---|---|
|
Above World Average |
|||||||
| 1 | LinkedIn users | # People | 7,145,162 | 3 | 1126 | ||
| 2 | LinkedIn Users as a % of Total LinkedIn Users | % People | 0 | 3 | 1129 | ||
| 3 | Instagram Users | Absolute | 10,458,072 | 3 | 1126 | ||
| 4 | Instagram Users as a % of Total Instagram Users | % People | 0 | 3 | 1130 | ||
| 5 | Instagram Users as a % of Total Internet Users | % People | 36 | 3 | 1125 | ||
| 6 | Facebook users | # People | 11,706,915 | 4 | 1127 | ||
| 7 | X (Twitter) users | # People | 1,789,045 | 4 | 1130 | ||
| 8 | X (Twitter) Users as a % of Total X (Twitter) Users | % People | 0 | 4 | 1127 | ||
| 9 | Facebook Users as a % of Total facebook Users | % People | 0 | 4 | 1129 | ||
| 10 | Internet Users | # People | 28,543,790 | 5 | 1129 | ||
| 11 | Instagram Users as a % of Total Population | % People | 29 | 7 | 1128 | ||
| 12 | LinkedIn Users as a % of Total Population | % People | 34 | 42 | 1125 | ||
| 13 | LinkedIn Users as a % of Total Internet Users | % People | 37 | 42 | 1127 | ||
| 14 | FB Users / Total Int. Users %. | % People | 34 | 68 | 1126 | ||
| 15 | FB Users / Total Pop. %. | % People | 27 | 70 | 1128 | ||
| 16 | Int. Users / Total Pop.% | % People | 69 | 77 | 1128 | ||
|
Below World Average |
|||||||
| 1 | Facebook CPC in Rs. | Absolute | 5 | 150 | 1231 | ||
| 2 | X (Twitter) Users as a % of Total Population | % People | 13 | 55 | 1230 | ||
| 3 | X (Twitter) Users as a % of Total Internet Users | % People | 12 | 54 | 1230 | ||
| Sr. | Title | Metric | World Average | Rank out of 195 | Value | ||
|---|---|---|---|---|---|---|---|
|
Above World Average |
|||||||
| 1 | Enrolment in tertiary edu.(all programmes) | # People | 1,420,982 | 4 | 1125 | ||
| 2 | Enrolment in secondary edu. | # People | 3,225,437 | 5 | 1130 | ||
| 3 | Teachers in primary edu. | # People | 112,672 | 5 | 1129 | ||
| 4 | Teachers in secondary edu. | # People | 201,153 | 5 | 1126 | ||
| 5 | Total Literate Pop. | # People | 34,678,001 | 5 | 1126 | ||
| 6 | # Total Students (Primary+Secondary+Tertiary) | # People | 38,831,325 | 5 | 1126 | ||
| 7 | Teachers in tertiary edu. | # People | 80,879 | 6 | 1129 | ||
| 8 | Enrolment in primary edu. | # People | 3,831,465 | 10 | 1129 | ||
| 9 | Literacy Rate (%) | % People | 86 | 113 | 1130 | ||
|
Below World Average |
|||||||
| 1 | Enrolment in Primary Edu./Total Pop %. | % People | 27 | 134 | 1231 | ||
| 2 | Enrolment in Primary Edu./ Total Literate Pop %. | % People | 36 | 131 | 1235 | ||
| 3 | # Students per teacher in Primary edu. | Ratio | 260 | 110 | 1232 | ||
| 4 | Teachers as a % of Enrolment | % People | 41 | 70 | 1233 | ||
| 5 | # Students per teacher in tertiary edu. | Ratio | 58 | 40 | 1234 | ||
| 6 | # Students per teacher in secondary edu. | Ratio | 57 | 73 | 1230 | ||
| 7 | Enrolment in Tertiary Edu./ Total Pop. %. | % People | 9 | 35 | 1231 | ||
| 8 | Enrolment in Tertiary Edu/Total Literate Pop. %. | % People | 9 | 31 | 1235 | ||
| 9 | # Total Teachers (Primary+Secondary+Tertiary) | # People | 2,895,876 | 5 | 1234 | ||
| 10 | Enrolment in Secondary Edu./Total Literate Pop. | % People | 28 | 38 | 1235 | ||
| 11 | Enrolment in Secondary Edu./Total Pop %. | % People | 23 | 25 | 1234 | ||
| Sr. | Title | Metric | World Average | Rank out of 195 | Value | ||
|---|---|---|---|---|---|---|---|
|
Above World Average |
|||||||
| 1 | Employment in Services | # People | 10,251,634 | 4 | 1125 | ||
| 2 | Unemployed Labour Force. | # People | 1,511,199 | 4 | 1127 | ||
| 3 | Formal Jobs | # People | 10,605,934 | 4 | 1130 | ||
| 4 | Labour Force Participation | # People | 14,659,929 | 5 | 1128 | ||
| 5 | Non-Agricultural Labour Force | # People | 15,067,127 | 5 | 1126 | ||
| 6 | Total Labour Force (2021) | # People | 20,641,663 | 6 | 1129 | ||
| 7 | Employment in Agriculture | # People | 5,314,003 | 17 | 1130 | ||
| 8 | Unemployment Rate. | % People | 6 | 30 | 1126 | ||
| 9 | Employment in Services / Total Labour Force %. | % People | 57 | 41 | 1128 | ||
| 10 | Employment in services/Total Labour force %. | % People | 56 | 41 | 1125 | ||
| 11 | Employment in Services /Total pop.%. | % People | 25 | 44 | 1130 | ||
| 12 | Non-Agri Labour force/Total Labour force %. | % People | 76 | 59 | 1129 | ||
| 13 | Total Labour Force/Total Pop. | % People | 43 | 70 | 1125 | ||
| 14 | Wage & Salaried Workers / Total Labour Force % | % People | 59 | 77 | 1130 | ||
|
Below World Average |
|||||||
| 1 | Employment in Agri. / Total Labour Force % . | % People | 23 | 120 | 1232 | ||
| 2 | Employment in Agriculture/Total Labour force %. | % People | 23 | 120 | 1235 | ||
| 3 | Employment in Agriculture /Total Pop. %. | % People | 9 | 111 | 1235 | ||
| Sr. | Title | Metric | World Average | Rank out of 195 | Value | ||
|---|---|---|---|---|---|---|---|
|
Above World Average |
|||||||
| 1 | # Mobile phone numbers | Count | 40,393,496 | 5 | 1125 | ||
| 2 | # Theaters | Count | 310 | 6 | 1126 | ||
| 3 | Theaters/Total Theaters %. | Percent | 0 | 6 | 1128 | ||
| 4 | # Phone Numbers /Total Pop. % | Percent | 101 | 87 | 1130 | ||
|
Below World Average |
|||||||
| 1 | Theaters per 100000 | Ratio | 1 | 40 | 1235 | ||
| Sr. | Title | Metric | World Average | Rank out of 195 | Value | ||
|---|---|---|---|---|---|---|---|
|
Above World Average |
|||||||
| 1 | Total No. of Doctors | # People | 78,648 | 5 | 1127 | ||
| 2 | Total No. of Pharmacists | # People | 19,528 | 6 | 1126 | ||
| 3 | Dentist to doctor ratio | Ratio | 3 | 22 | 1127 | ||
| 4 | Life Expectancy at Birth, both sexes | Age | 73 | 72 | 1128 | ||
| 5 | No. of people HIV infected/Total pop. | # People | 5,202 | 5 | 1126 | ||
|
Below World Average |
|||||||
| 1 | Dentist (per 10,000) | People per 10000 | 31 | 62 | 1233 | ||
| Sr. | Title | Metric | World Average | Rank out of 195 | Value | ||
|---|---|---|---|---|---|---|---|
|
Above World Average |
|||||||
| 1 | Total Population | # People | 42,357,833 | 7 | 1128 | ||
| 2 | Male Population | # People | 21,291,067 | 7 | 1128 | ||
| 3 | Female Population | # People | 21,066,765 | 7 | 1125 | ||
| 4 | Total Births | # People | 677,551 | 10 | 1126 | ||
| 5 | Female % of Total Pop. | % People | 50 | 58 | 1127 | ||
| 6 | Total Deaths | # People | 321,991 | 9 | 1128 | ||
|
Below World Average |
|||||||
| 1 | Population Growth Rate (%) | % People | 0 | 138 | 1233 | ||
| 2 | Male % of Total Pop. | % People | 50 | 138 | 1231 | ||
Mother Tongue : Portuguese
Literacy Rate (%) : 93.20
| Country Capital | : | Brasilia |
|---|---|---|
| GDP Per Capita | : | 9,964 |
| GDP Per Capita Rank | : | 78th/195 |
| Life Expectancy | : | 76 |
| Unemployment Rate | : | 7 |
| Number of Internet Users | : | 179,712,983 |
| Internet Users Rank | : | 5th/195 |
| Area | : | 8,358,079 |
| Area Rank | : | 5th/195 |
| Total Population | : | 213,562,666 |
| Total Population Rank | : | 7th/195 |
| Sr. | City | Total City Population (2023) |
|---|---|---|
| 1 | Abaetetuba | 164,993 |
| 2 | Abreu e Lima | 104,081 |
| 3 | Açailândia | 117,363 |
| 4 | Aguas Lindas de Goiás | 225,802 |
| 5 | Alagoinhas | 158,041 |
| 6 | Almirante Tamandaré | 124,523 |
| 7 | Altamira | 120,269 |
| 8 | Alvorada | 219,265 |
| 9 | Americana | 251,122 |
| 10 | Ananindeua | 555,685 |
| 11 | Anápolis | 406,465 |
| 12 | Angra dos Reis | 214,803 |
| 13 | Aparecida de Goiania | 612,343 |
| 14 | Apucarana | 141,334 |
| 15 | Aracaju | 689,963 |
| 16 | Araçatuba | 203,492 |
| 17 | Aracruz | 108,854 |
| 18 | Araguaina | 190,209 |
| 19 | Araguari | 121,306 |
| 20 | Arapiraca | 241,783 |
| 21 | Arapongas | 129,504 |
| 22 | Araraquara | 247,283 |
| 23 | Araras | 138,532 |
| 24 | Araruama | 139,259 |
| 25 | Araucária | 151,711 |
| 26 | Araxá | 111,345 |
| 27 | Ariquemes | 113,628 |
| 28 | Assis | 108,958 |
| 29 | Atibaia | 149,428 |
| 30 | Bacabal | 108,543 |
| 31 | Bagé | 125,872 |
| 32 | Balneário Camboriú | 151,192 |
| 33 | Barbacena | 143,409 |
| 34 | Barcarena | 131,787 |
| 35 | Barra do Piraí | 104,496 |
| 36 | Barra Mansa | 191,766 |
| 37 | Barreiras | 162,814 |
| 38 | Barretos | 127,429 |
| 39 | Barueri | 287,338 |
| 40 | Bauru | 393,494 |
| 41 | Belém | 1,556,127 |
| 42 | Belford Roxo | 532,441 |
| 43 | Belo Horizonte | 2,824,085 |
| 44 | Bento Gonçalves | 126,391 |
| 45 | Betim | 461,463 |
| 46 | Birigui | 129,504 |
| 47 | Blumenau | 375,438 |
| 48 | Boa Vista | 435,417 |
| 49 | Botucatu | 153,683 |
| 50 | Bragança | 133,759 |
| 51 | Bragança Paulista | 182,115 |
| 52 | Brasilia | 3,153,968 |
| 53 | Breves | 107,298 |
| 54 | Brusque | 142,787 |
| 55 | Cabo de Santo Agostinho | 216,774 |
| 56 | Cabo Frio | 238,981 |
| 57 | Cachoeirinha | 136,146 |
| 58 | Cachoeiro de Itapemirim | 218,435 |
| 59 | Caieiras | 106,571 |
| 60 | Camacari | 315,770 |
| 61 | Camaragibe | 164,786 |
| 62 | Cambé | 111,345 |
| 63 | Cametá | 144,551 |
| 64 | Campina Grande | 427,323 |
| 65 | Campinas | 1,259,450 |
| 66 | Campo Grande | 940,151 |
| 67 | Campo Largo | 138,844 |
| 68 | Campos dos Goytacazes | 530,366 |
| 69 | Canoas | 361,325 |
| 70 | Caraguatatuba | 127,948 |
| 71 | Carapicuíba | 418,295 |
| 72 | Cariacica | 398,371 |
| 73 | Caruaru | 378,966 |
| 74 | Cascavel | 344,826 |
| 75 | Castanhal | 210,860 |
| 76 | Catalão | 115,080 |
| 77 | Catanduva | 127,014 |
| 78 | Caucaia | 378,966 |
| 79 | Caxias | 171,738 |
| 80 | Caxias do Sul | 536,903 |
| 81 | Chapecó | 232,444 |
| 82 | Codo | 127,740 |
| 83 | Colatina | 128,051 |
| 84 | Colombo | 255,792 |
| 85 | Conselheiro Lafaiete | 134,485 |
| 86 | Contagem | 694,114 |
| 87 | Coronel Fabriciano | 114,354 |
| 88 | Corumbá | 116,222 |
| 89 | Cotia | 263,159 |
| 90 | Crato | 138,013 |
| 91 | Criciúma | 225,491 |
| 92 | Cubatao | 136,561 |
| 93 | Cuiabá | 641,399 |
| 94 | Curitiba | 2,022,051 |
| 95 | Diadema | 442,784 |
| 96 | Divinópolis | 249,462 |
| 97 | Dourados | 233,896 |
| 98 | Duque de Caxias | 959,452 |
| 99 | Embu | 286,923 |
| 100 | Erechim | 110,618 |
| 101 | Eunápolis | 118,608 |
| 102 | Fazenda Rio Grande | 105,845 |
| 103 | Feira de Santana | 642,955 |
| 104 | Ferraz de Vasconcelos | 203,907 |
| 105 | Florianópolis | 527,979 |
| 106 | Formosa | 128,259 |
| 107 | Fortaleza | 2,805,199 |
| 108 | Foz do Iguaçu | 267,933 |
| 109 | Franca | 369,315 |
| 110 | Francisco Morato | 182,219 |
| 111 | Franco da Rocha | 162,295 |
| 112 | Garanhuns | 145,796 |
| 113 | Goiânia | 1,593,899 |
| 114 | Governador Valadares | 291,592 |
| 115 | Gravatai | 294,290 |
| 116 | Guarapari | 131,476 |
| 117 | Guarapuava | 189,483 |
| 118 | Guaratinguetá | 127,118 |
| 119 | Guarujá | 334,864 |
| 120 | Guarulhos | 1,444,574 |
| 121 | Hortolandia | 230,472 |
| 122 | Ibirité | 188,964 |
| 123 | Igarassu | 122,759 |
| 124 | Iguatu | 106,883 |
| 125 | Ilhéus | 165,927 |
| 126 | Imperatriz | 269,074 |
| 127 | Indaiatuba | 265,857 |
| 128 | Ipatinga | 275,404 |
| 129 | Itabira | 125,457 |
| 130 | Itaboraí | 251,641 |
| 131 | Itabuna | 221,652 |
| 132 | Itaguaí | 125,457 |
| 133 | Itajaí | 216,878 |
| 134 | Itapecerica da Serra | 175,474 |
| 135 | Itapetininga | 164,578 |
| 136 | Itapevi | 235,038 |
| 137 | Itapipoca | 130,957 |
| 138 | Itaquaquecetuba | 370,249 |
| 139 | Itatiba | 119,231 |
| 140 | Itu | 174,955 |
| 141 | Ituiutaba | 107,816 |
| 142 | Itumbiara | 105,326 |
| 143 | Jaboatao dos Guararapes | 717,151 |
| 144 | Jacareí | 236,802 |
| 145 | Jandira | 124,731 |
| 146 | Japeri | 104,392 |
| 147 | Jaraguá do Sul | 173,606 |
| 148 | Jaú | 150,258 |
| 149 | Jequié | 168,003 |
| 150 | Ji-Paraná | 136,561 |
| 151 | Joao Pessoa | 831,920 |
| 152 | Joinville | 591,382 |
| 153 | Juazeiro | 228,604 |
| 154 | Juàzeiro do Norte | 278,310 |
| 155 | Juiz de Fora | 580,694 |
| 156 | Jundiaí | 420,993 |
| 157 | Lagarto | 107,090 |
| 158 | Lages | 164,578 |
| 159 | Lauro de Freitas | 201,935 |
| 160 | Lavras | 105,015 |
| 161 | Leme | 104,081 |
| 162 | Limeira | 309,959 |
| 163 | Linhares | 172,776 |
| 164 | Londrina | 574,260 |
| 165 | Luziânia | 204,322 |
| 166 | Macae | 248,528 |
| 167 | Macapá | 483,047 |
| 168 | Maceió | 1,060,212 |
| 169 | Magé | 245,207 |
| 170 | Manaus | 2,173,347 |
| 171 | Maraba | 276,961 |
| 172 | Maracanau | 231,613 |
| 173 | Maranguape | 129,816 |
| 174 | Maricá | 155,550 |
| 175 | Marília | 242,405 |
| 176 | Maringá | 418,295 |
| 177 | Marituba | 130,127 |
| 178 | Mauá | 474,953 |
| 179 | Mesquita | 177,446 |
| 180 | Moji das Cruzes | 445,482 |
| 181 | Moji-Guaçu | 153,890 |
| 182 | Montes Claros | 413,314 |
| 183 | Mossoró | 302,903 |
| 184 | Muriaé | 111,967 |
| 185 | Natal | 910,784 |
| 186 | Nilópolis | 164,267 |
| 187 | Niterói | 516,668 |
| 188 | Nossa Senhora do Socorro | 186,474 |
| 189 | Nova Friburgo | 192,077 |
| 190 | Nova Iguaçu | 827,458 |
| 191 | Novo Gama | 112,486 |
| 192 | Nôvo Hamburgo | 258,490 |
| 193 | Olinda | 404,805 |
| 194 | Osasco | 722,650 |
| 195 | Ourinhos | 115,288 |
| 196 | Paço do Lumiar | 124,420 |
| 197 | Palhoça | 167,484 |
| 198 | Palmas | 290,451 |
| 199 | Paragominas | 112,590 |
| 200 | Paranaguá | 157,522 |
| 201 | Parauapebas | 203,699 |
| 202 | Parintins | 116,948 |
| 203 | Parnaíba | 155,862 |
| 204 | Parnamirim | 257,971 |
| 205 | Passo Fundo | 205,256 |
| 206 | Passos | 118,090 |
| 207 | Patos | 111,137 |
| 208 | Patos de Minas | 155,550 |
| 209 | Paulínia | 103,873 |
| 210 | Paulista | 337,873 |
| 211 | Paulo Afonso | 124,420 |
| 212 | Pelotas | 356,656 |
| 213 | Petrolina | 350,429 |
| 214 | Petrópolis | 309,440 |
| 215 | Pindamonhangaba | 168,418 |
| 216 | Pinhais | 133,136 |
| 217 | Piracicaba | 409,267 |
| 218 | Piraquara | 110,099 |
| 219 | Poà | 119,024 |
| 220 | Poços de Caldas | 171,116 |
| 221 | Ponta Grossa | 353,958 |
| 222 | Porto Alegre | 1,536,825 |
| 223 | Porto Seguro | 152,956 |
| 224 | Porto Velho | 530,469 |
| 225 | Pouso Alegre | 150,985 |
| 226 | Praia Grande | 316,185 |
| 227 | Presidente Prudente | 232,132 |
| 228 | Queimados | 149,947 |
| 229 | Recife | 1,686,876 |
| 230 | Resende | 130,853 |
| 231 | Ribeirao das Neves | 338,081 |
| 232 | Ribeirao Pires | 125,665 |
| 233 | Ribeirao Prêto | 699,821 |
| 234 | Rio Branco | 391,315 |
| 235 | Rio Claro | 209,095 |
| 236 | Rio das Ostras | 141,749 |
| 237 | Rio de Janeiro | 6,743,768 |
| 238 | Rio Grande | 216,463 |
| 239 | Rio Verde | 220,199 |
| 240 | Rondonópolis | 227,151 |
| 241 | Sabára | 140,296 |
| 242 | Salto | 119,542 |
| 243 | Salvador | 3,048,850 |
| 244 | Santa Bárbara D'Oeste | 198,200 |
| 245 | Santa Cruz do Capibaribe | 107,609 |
| 246 | Santa Cruz do Sul | 131,580 |
| 247 | Santa Luzia | 225,802 |
| 248 | Santa Maria | 287,753 |
| 249 | Santa Rita | 141,023 |
| 250 | Santana | 118,193 |
| 251 | Santana de Parnaíba | 134,174 |
| 252 | Santarém | 305,601 |
| 253 | Santo André | 739,565 |
| 254 | Santo Antônio de Jesus | 106,364 |
| 255 | Santos | 450,774 |
| 256 | Sao Bernardo do Campo | 853,192 |
| 257 | Sao Caetano do Sul | 164,786 |
| 258 | Sao Carlo | 252,990 |
| 259 | São Gonçalo | 1,083,457 |
| 260 | Sao Joao de Meriti | 477,858 |
| 261 | Sao José | 244,896 |
| 262 | Sao José de Ribamar | 182,634 |
| 263 | Sao José do Rio Prêto | 463,538 |
| 264 | Sao José dos Campos | 722,235 |
| 265 | Sao José dos Pinhais | 314,214 |
| 266 | Sao Leopoldo | 238,358 |
| 267 | São Lourenço da Mata | 115,392 |
| 268 | Sao Luís | 1,123,719 |
| 269 | São Mateus | 131,165 |
| 270 | Sao Paulo | 12,491,973 |
| 271 | Sao Vicente | 371,495 |
| 272 | Sapucaia do Sul | 144,136 |
| 273 | Senador Canedo | 106,779 |
| 274 | Serra | 512,725 |
| 275 | Sertãozinho | 125,976 |
| 276 | Sete Lagoas | 243,028 |
| 277 | Simoes Filho | 139,777 |
| 278 | Sinop | 137,910 |
| 279 | Sobral | 211,378 |
| 280 | Sorocaba | 677,096 |
| 281 | Sumaré | 279,659 |
| 282 | Suzano | 298,960 |
| 283 | Taboao da Serra | 286,300 |
| 284 | Tailândia | 104,081 |
| 285 | Tatuí | 122,240 |
| 286 | Taubaté | 316,704 |
| 287 | Teixeira de Freitas | 165,824 |
| 288 | Teófilo Otoni | 146,834 |
| 289 | Teresina | 879,342 |
| 290 | Teresópolis | 181,181 |
| 291 | Timon | 172,569 |
| 292 | Toledo | 138,844 |
| 293 | Três Lagoas | 119,957 |
| 294 | Trindade | 123,901 |
| 295 | Tubarão | 107,609 |
| 296 | Tucuruí | 113,005 |
| 297 | Ubá | 116,429 |
| 298 | Uberaba | 337,562 |
| 299 | Uberlândia | 694,944 |
| 300 | Umuarama | 113,212 |
| 301 | Uruguaiana | 134,589 |
| 302 | Valinhos | 126,806 |
| 303 | Valparaíso de Goiás | 162,295 |
| 304 | Varginha | 138,428 |
| 305 | Varzea Grande | 281,526 |
| 306 | Varzea Paulista | 122,240 |
| 307 | Vespasiano | 125,042 |
| 308 | Viamao | 262,433 |
| 309 | Vila Velha | 497,782 |
| 310 | Vitória | 373,155 |
| 311 | Vitória da Conquista | 359,146 |
| 312 | Vitória de Santo Antao | 141,853 |
| 313 | Volta Redonda | 273,640 |
| 314 | Votorantim | 123,382 |
Q - Does Prarang do surveys to collect data? How does Prarang have such granular
Country-level details which no private or public data source offers?
A - Prarang does not conduct surveys to gather data; instead, we rely on publicly available
sources such as UN Population data, the CIA World Factbook, and private surveys whose results
are accessible through news media and public websites. Our data classification follows a
three-fold method rooted in Indian logic (Tarkashastra): Pramana (evidence-based data
collection) involves gathering data from credible sources; Anumana (estimation and inference)
uses modeling to draw inferences from the collected data; and Upamana (comparison) ranks
countries through relative comparison, calculating the Samana (country average) to determine
whether each country ranks above or below this benchmark. All data sources and estimation
modeling methods are transparently detailed and accessible, with information available for each
data field by clicking the "i" icon.
A - Prarang does not do any surveys. It does data modeling & estimations based on third-party census & surveys, already in the public domain. It also shares the source of the data it uses. Users need to make their own judgment of how and for what purpose and when they use the data that they download from this Prarang website.