Analytics: World
Analytics: World
Date: August 1, 2026
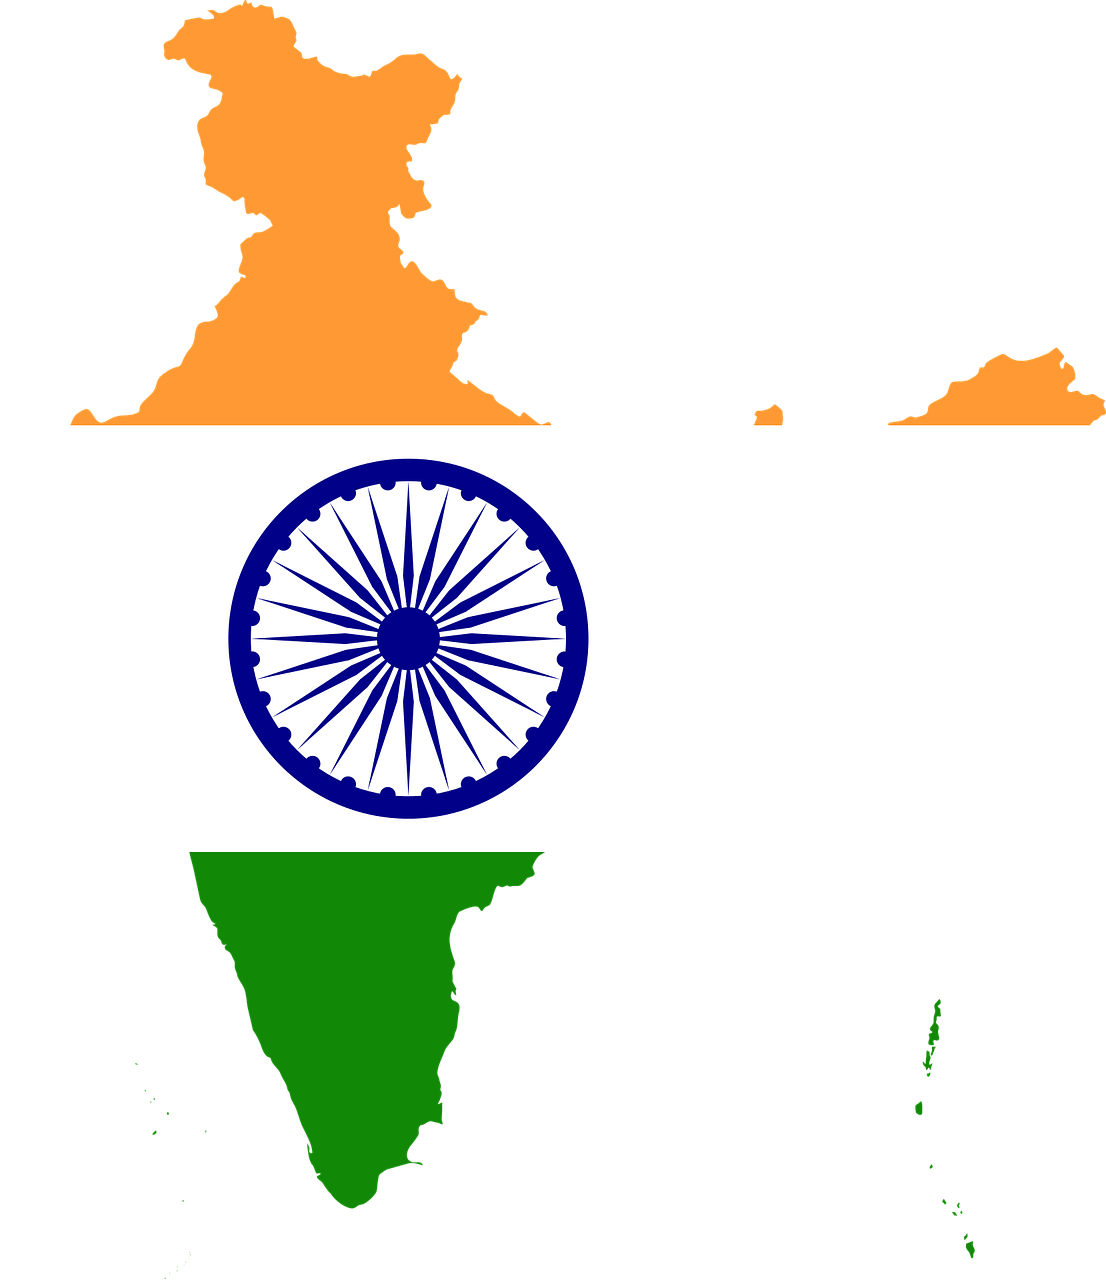
 India is a large country with 17.9% of the world's population. India is a democratic, republic country. It has 43 world heritage sites. It is home to 10.3% Muslims and 94.8% Hindus of the world. It produces 25.8% Rice, 13.3% Wheat, 15.1% Potatoes, 3.7% Soyabean, and 28.5% Onions of the world. It is rich in resources and has 1.3% Uranium, 5.9% Bauxite, 3.2% Silver, and 7.9% Zinc of the world.
India is the 1st ranked country in population and 7th ranked in area out of 195 countries in the world. Please keep the country rank in perspective, for the highlights below.
 Total Population
 Facebook users
 Enrolment in primary edu.
 Enrolment in secondary edu.
The Average Total Population of 195 countries in the world is 42,357,833. India is the 1st highest ranked country out of 195 countries. Taking into context the total population of the world, this country is more populated in comparison to other countries.
Out of 195 countries in the world, India is the 1st highest ranked in Facebook users . This may take into context a higher country population, or may simply imply that this country has more social media popularity, or may have a higher youth demographic.
India is the 1st highest ranked in Enrolment in primary edu. out of all the 195 countries.This may take into context a higher country population, or imply that more people in this country pursue primary education when compared to other countries.
The Average Enrolment in secondary edu. of 195 countries in the world is 3,225,437. India is the 1st highest ranked country out of 195 countries. This may take into context a higher country population, or imply that more people in this country pursue secondary education when compared to other countries.
 Literacy Rate (%)
 GDP Per Capita (USD)
 Oil Prod.
 Barley prod.
Out of 195 countries in the world, India is the 37th worst ranked in Literacy Rate (%) . This indicates that the educational infrastructure in this country is worse than it is in other countries.
India is the 57th worst ranked in GDP Per Capita (USD) out of all the 195 countries.This implies that this country is a developing country.
The Average Oil Prod. of 195 countries in the world is 855,887. India is the 170th worst ranked country out of 195 countries. This indicates that natural resources are scarce in this country when compared to other countries, and it may be a huge importer of such resources.
Out of 195 countries in the world, India is the 171st worst ranked in Barley prod. . This is indicative of less focus on the production of barley, or scarcity of fertile land, or higher industrialisation as compared to other countries.
| Sr. | Title | Metric | World Average | Rank out of 195 | Value | ||
|---|---|---|---|---|---|---|---|
|
Above World Average |
|||||||
| 1 | Total Population | # People | 42,357,833 | 1 | 1125 | ||
| 2 | Male Population | # People | 21,291,067 | 1 | 1127 | ||
| 3 | Female Population | # People | 21,066,765 | 1 | 1130 | ||
| 4 | Total Births | # People | 677,551 | 1 | 1128 | ||
| 5 | Male % of Total Pop. | % People | 50 | 16 | 1129 | ||
| 6 | Total Deaths | # People | 321,991 | 2 | 1127 | ||
|
Below World Average |
|||||||
| 1 | Female % of Total Pop. | % People | 50 | 180 | 1234 | ||
| 2 | Population Growth Rate (%) | % People | 0 | 96 | 1233 | ||
| Sr. | Title | Metric | World Average | Rank out of 195 | Value | ||
|---|---|---|---|---|---|---|---|
|
Above World Average |
|||||||
| 1 | Assamese | # People | 15,311,351 | 1 | 1128 | ||
| 2 | Gujarati | # People | 3,567,082 | 1 | 1129 | ||
| 3 | Hindi | # People | 57,280,639 | 1 | 1129 | ||
| 4 | Kannada | # People | 51,431,000 | 1 | 1129 | ||
| 5 | Malayalam | # People | 45,716,000 | 1 | 1127 | ||
| 6 | Marathi | # People | 95,718,000 | 1 | 1128 | ||
| 7 | Odia | # People | 35,000,000 | 1 | 1129 | ||
| 8 | Tamil | # People | 14,930,166 | 1 | 1129 | ||
| 9 | Telugu | # People | 7,474,845 | 1 | 1128 | ||
| 10 | Urdu | # People | 15,368,166 | 1 | 1129 | ||
| 11 | Assamese as a % of total Assamese speakers | % People | 0 | 1 | 1128 | ||
| 12 | Gujarati as a % of total Gujarati speakers | % People | 0 | 1 | 1126 | ||
| 13 | Gurumukhi as a % of total Gurumukhi speakers | % People | 0 | 1 | 1130 | ||
| 14 | Hindi as a % of total Hindi speakers | % People | 0 | 1 | 1128 | ||
| 15 | Kannada as a % of total Kannada speakers | % People | 0 | 1 | 1130 | ||
| 16 | Malayalam as a % of total Malayalam speakers | % People | 0 | 1 | 1125 | ||
| 17 | Marathi as a % of total Marathi speakers | % People | 0 | 1 | 1130 | ||
| 18 | Odia as a % of total Odia speakers | % People | 0 | 1 | 1127 | ||
| 19 | Tamil as a % of total Tamil speakers | % People | 0 | 1 | 1130 | ||
| 20 | Telugu as a % of total Telugu speakers | % People | 0 | 1 | 1129 | ||
| 21 | Bodo | 55,375 | 1 | 1129 | |||
| 22 | Dongri | 555,652 | 1 | 1125 | |||
| 23 | Kashmiri | 2,396,058 | 1 | 1129 | |||
| 24 | Konkani | 480,040 | 1 | 1128 | |||
| 25 | Maithili | 977,665 | 1 | 1129 | |||
| 26 | Manipuri | 119,531 | 1 | 1125 | |||
| 27 | Sanskrit | 13,462 | 1 | 1126 | |||
| 28 | Santali | 194,476 | 1 | 1125 | |||
| 29 | Sindhi | 2,447,159 | 1 | 1130 | |||
| 30 | Bodo as a % of total Bodo speakers | 0 | 1 | 1129 | |||
| 31 | Dongri as a % of total Dongri speakers | 0 | 1 | 1130 | |||
| 32 | Kashmiri as a % of total Kashmiri speakers | 0 | 1 | 1125 | |||
| 33 | Konkani as a % of total Bodo speakers | 0 | 1 | 1129 | |||
| 34 | Maithili as a % of total Maithili speakers | 0 | 1 | 1126 | |||
| 35 | Manipuri as a % of total Manipuri speakers | 0 | 1 | 1126 | |||
| 36 | Sanskrit as a % of total Sanskrit speakers | 0 | 1 | 1128 | |||
| 37 | Santali as a % of total Santali speakers | 0 | 1 | 1127 | |||
| 38 | Sindhi as a % of total Sindhi speakers | 0 | 1 | 1125 | |||
| 39 | Bengali | # People | 71,219,000 | 2 | 1126 | ||
| 40 | Gurumukhi | # People | 39,202,250 | 2 | 1130 | ||
| 41 | Urdu as a % of total Urdu speakers | % People | 0 | 2 | 1128 | ||
| 42 | English | # People | 10,677,446 | 4 | 1129 | ||
| 43 | English as a % of total English speakers | % People | 0 | 4 | 1125 | ||
|
Below World Average |
|||||||
| 1 | Armenian | # People | 159,989 | 31 | 1235 | ||
| 2 | Armenian as a % of total Armenian speakers | % People | 0 | 30 | 1235 | ||
| 3 | Nepali | # People | 5,584,666 | 2 | 1231 | ||
| Sr. | Title | Metric | World Average | Rank out of 195 | Value | ||
|---|---|---|---|---|---|---|---|
|
Above World Average |
|||||||
| 1 | Facebook users | # People | 11,706,915 | 1 | 1130 | ||
| 2 | Facebook Users as a % of Total facebook Users | % People | 0 | 1 | 1127 | ||
| 3 | Instagram Users | Absolute | 10,458,072 | 1 | 1128 | ||
| 4 | Instagram Users as a % of Total Instagram Users | % People | 0 | 1 | 1130 | ||
| 5 | Internet Users | # People | 28,543,790 | 2 | 1129 | ||
| 6 | LinkedIn users | # People | 7,145,162 | 2 | 1126 | ||
| 7 | LinkedIn Users as a % of Total LinkedIn Users | % People | 0 | 2 | 1125 | ||
| 8 | X (Twitter) users | # People | 1,789,045 | 3 | 1127 | ||
| 9 | X (Twitter) Users as a % of Total X (Twitter) Users | % People | 0 | 3 | 1129 | ||
| 10 | Instagram Users as a % of Total Internet Users | % People | 36 | 66 | 1128 | ||
| 11 | Instagram Users as a % of Total Population | % People | 29 | 98 | 1129 | ||
|
Below World Average |
|||||||
| 1 | Facebook CPC in Rs. | Absolute | 5 | 142 | 1235 | ||
| 2 | X (Twitter) Users as a % of Total Internet Users | % People | 12 | 136 | 1231 | ||
| 3 | X (Twitter) Users as a % of Total Population | % People | 13 | 131 | 1232 | ||
| 4 | Int. Users / Total Pop.% | % People | 69 | 128 | 1233 | ||
| 5 | FB Users / Total Pop. %. | % People | 27 | 126 | 1231 | ||
| 6 | FB Users / Total Int. Users %. | % People | 34 | 124 | 1232 | ||
| 7 | LinkedIn Users as a % of Total Internet Users | % People | 37 | 121 | 1230 | ||
| 8 | LinkedIn Users as a % of Total Population | % People | 34 | 116 | 1234 | ||
| Sr. | Title | Metric | World Average | Rank out of 195 | Value | ||
|---|---|---|---|---|---|---|---|
|
Above World Average |
|||||||
| 1 | Enrolment in primary edu. | # People | 3,831,465 | 1 | 1125 | ||
| 2 | Enrolment in secondary edu. | # People | 3,225,437 | 1 | 1127 | ||
| 3 | # Total Students (Primary+Secondary+Tertiary) | # People | 38,831,325 | 1 | 1130 | ||
| 4 | Enrolment in tertiary edu.(all programmes) | # People | 1,420,982 | 2 | 1125 | ||
| 5 | Teachers in secondary edu. | # People | 201,153 | 2 | 1129 | ||
| 6 | Total Literate Pop. | # People | 34,678,001 | 2 | 1129 | ||
| 7 | # Total Teachers (Primary+Secondary+Tertiary) | # People | 2,895,876 | 2 | 1130 | ||
| 8 | Teachers in tertiary edu. | # People | 80,879 | 3 | 1127 | ||
| 9 | Teachers in primary edu. | # People | 112,672 | 4 | 1129 | ||
|
Below World Average |
|||||||
| 1 | Teachers as a % of Enrolment | % People | 41 | 110 | 1234 | ||
| 2 | Literacy Rate (%) | % People | 86 | 159 | 1234 | ||
| 3 | Enrolment in Tertiary Edu./ Total Pop. %. | % People | 9 | 91 | 1231 | ||
| 4 | Enrolment in Primary Edu./Total Pop %. | % People | 27 | 113 | 1234 | ||
| 5 | Enrolment in Tertiary Edu/Total Literate Pop. %. | % People | 9 | 64 | 1234 | ||
| 6 | Enrolment in Primary Edu./ Total Literate Pop %. | % People | 36 | 87 | 1230 | ||
| 7 | # Students per teacher in tertiary edu. | Ratio | 58 | 22 | 1234 | ||
| 8 | # Students per teacher in secondary edu. | Ratio | 57 | 46 | 1235 | ||
| 9 | Enrolment in Secondary Edu./Total Pop %. | % People | 23 | 47 | 1232 | ||
| 10 | # Students per teacher in Primary edu. | Ratio | 260 | 27 | 1235 | ||
| 11 | Enrolment in Secondary Edu./Total Literate Pop. | % People | 28 | 23 | 1233 | ||
| Sr. | Title | Metric | World Average | Rank out of 195 | Value | ||
|---|---|---|---|---|---|---|---|
|
Above World Average |
|||||||
| 1 | # Cities>100000 | # Cities | 27 | 1 | 1129 | ||
| 2 | # Cities>300000 | # Cities | 11 | 1 | 1128 | ||
| 3 | Rural Pop. | # People | 18,013,759 | 1 | 1125 | ||
| 4 | # Cities>100000 | # Cities | 21 | 1 | 1127 | ||
| 5 | Urban Population (2021) | # People | 23,603,754 | 2 | 1129 | ||
| 6 | # Cities>500000 | # Cities | 7 | 2 | 1126 | ||
| 7 | # Cities>1M | # Cities | 4 | 2 | 1126 | ||
| 8 | # Cities>5M | # Cities | 1 | 2 | 1130 | ||
| 9 | # Cities>10M | # Cities | 1 | 2 | 1130 | ||
| 10 | # Cities>300000 | # Cities | 7 | 2 | 1128 | ||
| 11 | # Cities>500000 | # Cities | 4 | 2 | 1125 | ||
| 12 | # Cities>1M | # Cities | 1 | 2 | 1128 | ||
| 13 | # Cities>5M | # Cities | 0 | 2 | 1127 | ||
| 14 | # Cities>10M | # Cities | 0 | 2 | 1130 | ||
| 15 | Rural Pop. /Total Pop. % | % People | 40 | 36 | 1127 | ||
| 16 | Pop. with access to Electricity (%) | % People | 86 | 118 | 1127 | ||
| 17 | Pop. without Electricity access | # People | 3,455,508 | 18 | 1129 | ||
|
Below World Average |
|||||||
| 1 | Urban Population / Total Population % . | % People | 60 | 160 | 1233 | ||
| Sr. | Title | Metric | World Average | Rank out of 195 | Value | ||
|---|---|---|---|---|---|---|---|
|
Above World Average |
|||||||
| 1 | Cricket Playing Nations (ICC Members) | Count | 1 | 1 | 1126 | ||
| 2 | Hindu Population | # People | 52,631,217 | 1 | 1127 | ||
| 3 | Hindu Pop./Total Pop.%. | % People | 2 | 1 | 1130 | ||
| 4 | Hindu Pop./Total Hindu Pop.% | % People | 0 | 1 | 1128 | ||
| 5 | Islamic Population | # People | 10,091,996 | 3 | 1128 | ||
| 6 | Islamic Pop./Total Islamic Pop.% | % People | 0 | 3 | 1126 | ||
| 7 | World Heritage Sites | Count | 7 | 6 | 1125 | ||
| 8 | Buddhist Pop./Total Buddhist Pop. % | % People | 0 | 9 | 1126 | ||
| 9 | Christian Population | # People | 16,917,912 | 19 | 1128 | ||
| 10 | Christian Pop./Total Christian Pop.% | % People | 0 | 19 | 1126 | ||
|
Below World Average |
|||||||
| 1 | Christian Pop./Total Pop.% | % People | 42 | 136 | 1230 | ||
| 2 | Islamic Pop./Total Pop.% | % People | 22 | 69 | 1231 | ||
| 3 | Silver Medal | Count | 5 | 40 | 1234 | ||
| 4 | # Olympic Medals | Count | 146 | 48 | 1235 | ||
| 5 | Total Medals | Count | 12 | 35 | 1234 | ||
| 6 | Jewish Pop./Total Jewish Pop. % | % People | 0 | 33 | 1233 | ||
| 7 | Jewish Population | # People | 162,421 | 33 | 1233 | ||
| 8 | # Cannes Grand Prizes (Palme d'Or or Grand Prix) | 4 | 16 | 1230 | |||
| 9 | Share of Cannes Grand Prize Wins (% World) | 3 | 16 | 1235 | |||
| 10 | Bronze Medal | Count | 5 | 17 | 1234 | ||
| 11 | Buddhist Pop./Total Pop.%. | % People | 3 | 17 | 1233 | ||
| 12 | Buddhist Population | # People | 21,931,470 | 9 | 1232 | ||
| Sr. | Title | Metric | World Average | Rank out of 195 | Value | ||
|---|---|---|---|---|---|---|---|
|
Above World Average |
|||||||
| 1 | Onion prod. | Tons | 819,042 | 1 | 1130 | ||
| 2 | Onion Produced/Total Onion Produced % | Weight | 0 | 1 | 1130 | ||
| 3 | Cow Milk Production (in tonnes) | Weight | 3,855,383 | 1 | 1128 | ||
| 4 | Buffalo Milk Production (in tonnes) | Weight | 7,516,792 | 1 | 1128 | ||
| 5 | Goat Milk Production (in tonnes) | Weight | 196,989 | 1 | 1126 | ||
| 6 | Cow Milk Production (% of Total Cow Milk Production) | Percent | 0 | 1 | 1125 | ||
| 7 | Buffalo Milk Production (% of Total Buffalo Milk Production) | Percent | 4 | 1 | 1130 | ||
| 8 | Goat Milk Production (% of Total Goat Milk Production) | Percent | 0 | 1 | 1128 | ||
| 9 | Rice prod. | Tons | 6,920,442 | 2 | 1130 | ||
| 10 | Wheat prod. | Tons | 6,811,171 | 2 | 1125 | ||
| 11 | Potatoes prod. | Tons | 2,504,846 | 2 | 1127 | ||
| 12 | Sugarcane prod. | Tons | 20,929,075 | 2 | 1126 | ||
| 13 | Rice Produced/Total Rice Produced.% | Weight | 0 | 2 | 1130 | ||
| 14 | Wheat Produced /Total Wheat Produced. %. | Weight | 0 | 2 | 1127 | ||
| 15 | Potatoes Produced /Total Potatoes Produced % | Weight | 0 | 2 | 1125 | ||
| 16 | Sugarcane Produced/Total Sugarcane Produced.% | Weight | 2 | 2 | 1128 | ||
| 17 | Number of Cows | Count | 8,697,624 | 2 | 1126 | ||
| 18 | Goat Meat Production (in tonnes) | Weight | 46,111 | 2 | 1128 | ||
| 19 | Cotton Production (in 1000 480 lb. Bales) | Weight | 1,707 | 2 | 1128 | ||
| 20 | Coal Production (in 1000 metric tons) | Weight | 121,850 | 2 | 1128 | ||
| 21 | Cows (% of Total Cows) | Percent | 0 | 2 | 1129 | ||
| 22 | Goat Meat Production (% of Total Goat Meat Production) | Percent | 0 | 2 | 1126 | ||
| 23 | Cotton Production (% of Total Cotton Production) | Percent | 1 | 2 | 1129 | ||
| 24 | Coal Production (% of Total Coal Production) | Percent | 1 | 2 | 1125 | ||
| 25 | Honey prod. | Tons | 15,393 | 4 | 1126 | ||
| 26 | Honey Produced /Total Honey Produced % | Weight | 0 | 4 | 1127 | ||
| 27 | Chicken Meat Production (in tonnes) | Weight | 588,164 | 4 | 1130 | ||
| 28 | Iron Production (in 1000 metric tons) | Weight | 33,258 | 4 | 1129 | ||
| 29 | Orange Production (in tonnes) | Weight | 618,959 | 4 | 1130 | ||
| 30 | Chicken Meat Production (% of Total Chicken Meat Production) | Percent | 0 | 4 | 1130 | ||
| 31 | Iron Production (% of Total Iron Production) | Percent | 2 | 4 | 1127 | ||
| 32 | Orange Production (% of Total Orange Production) | Percent | 0 | 4 | 1130 | ||
| 33 | Soyabean prod. | Tons | 3,572,369 | 5 | 1128 | ||
| 34 | Soyabean Produced/Total Soyabean Produced % | Weight | 1 | 5 | 1126 | ||
| 35 | Apple Production (in tonnes) | Weight | 1,044,287 | 5 | 1125 | ||
| 36 | Apple Production (% of Total Apple Production) | Percent | 1 | 5 | 1127 | ||
| 37 | Country forest area / Global Forest area % | 0 | 9 | 1125 | |||
| 38 | Forest Area. | Area | 21,595,147 | 10 | 1126 | ||
| 39 | Sweet Potatoes prod. | Tons | 878,129 | 11 | 1125 | ||
| 40 | Sweet Potatoes Produced/Total Sweet Potatoes Produced % | Weight | 0 | 11 | 1126 | ||
| 41 | Number of Trees | Count | 15,642,617,148 | 79 | 1128 | ||
|
Below World Average |
|||||||
| 1 | Silver Produced/Total Silver Produced % | Weight | 9 | 11 | 1235 | ||
| 2 | Flourite Produced/Total Flourite Produced % | Weight | 4 | 21 | 1230 | ||
| 3 | Zinc Produced/Total Zinc Produced %. | Weight | 9 | 4 | 1230 | ||
| 4 | Uranium Produced/Total Uranium Produced % | Weight | 5 | 9 | 1231 | ||
| 5 | Bauxite Produced/Total Bauxite Produced % | Weight | 7 | 5 | 1232 | ||
| 6 | Tree density . | Density | 828 | 152 | 1230 | ||
| 7 | Tree density. | Density | 22,685 | 126 | 1235 | ||
| 8 | Natural Gas Produced/Total Natural Gas Produced % | Mass | 5 | 23 | 1234 | ||
| 9 | Oil Prodcuced/Total Oil Produced % | 5 | 26 | 1232 | |||
| 10 | Oil Prod. | Barrels/day | 855,887 | 26 | 1231 | ||
| 11 | Barley prod. | Tons | 1,545,003 | 25 | 1233 | ||
| 12 | Barley Produced/Total Barley Produced.% | Weight | 1 | 25 | 1231 | ||
| 13 | Natural Gas Prod. | Million cubic meters | 43,738 | 23 | 1232 | ||
| 14 | Flourite prod. | Tons | 231,501 | 21 | 1234 | ||
| 15 | Silver prod. | Tons | 1,980 | 11 | 1230 | ||
| 16 | Uranium prod. | Tons | 3,187 | 9 | 1231 | ||
| 17 | Bauxite prod. | Tons | 29,969 | 5 | 1234 | ||
| 18 | Zinc prod. | Tons | 1,007,000 | 4 | 1234 | ||
| Sr. | Title | Metric | World Average | Rank out of 195 | Value | ||
|---|---|---|---|---|---|---|---|
|
Above World Average |
|||||||
| 1 | Labour Force Participation | # People | 14,659,929 | 1 | 1130 | ||
| 2 | Employment in Agriculture | # People | 5,314,003 | 1 | 1130 | ||
| 3 | Total Labour Force (2021) | # People | 20,641,663 | 2 | 1129 | ||
| 4 | Employment in Services | # People | 10,251,634 | 2 | 1129 | ||
| 5 | Unemployed Labour Force. | # People | 1,511,199 | 2 | 1130 | ||
| 6 | Non-Agricultural Labour Force | # People | 15,067,127 | 2 | 1126 | ||
| 7 | Formal Jobs | # People | 10,605,934 | 3 | 1126 | ||
| 8 | Employment in Agri. / Total Labour Force % . | % People | 23 | 33 | 1126 | ||
| 9 | Employment in Agriculture/Total Labour force %. | % People | 23 | 33 | 1129 | ||
| 10 | Employment in Agriculture /Total Pop. %. | % People | 9 | 34 | 1127 | ||
|
Below World Average |
|||||||
| 1 | Employment in Services / Total Labour Force %. | % People | 57 | 160 | 1231 | ||
| 2 | Employment in services/Total Labour force %. | % People | 56 | 160 | 1232 | ||
| 3 | Wage & Salaried Workers / Total Labour Force % | % People | 59 | 151 | 1230 | ||
| 4 | Employment in Services /Total pop.%. | % People | 25 | 149 | 1234 | ||
| 5 | Non-Agri Labour force/Total Labour force %. | % People | 76 | 144 | 1235 | ||
| 6 | Total Labour Force/Total Pop. | % People | 43 | 116 | 1235 | ||
| 7 | Unemployment Rate. | % People | 6 | 80 | 1232 | ||
| Sr. | Title | Metric | World Average | Rank out of 195 | Value | ||
|---|---|---|---|---|---|---|---|
|
Above World Average |
|||||||
| 1 | Total No. of Pharmacists | # People | 19,528 | 1 | 1126 | ||
| 2 | Total No. of Doctors | # People | 78,648 | 3 | 1125 | ||
| 3 | No. of people HIV infected/Total pop. | # People | 5,202 | 3 | 1125 | ||
|
Below World Average |
|||||||
| 1 | Dentist (per 10,000) | People per 10000 | 31 | 161 | 1234 | ||
| 2 | Life Expectancy at Birth, both sexes | Age | 73 | 111 | 1235 | ||
| Sr. | Title | Metric | World Average | Rank out of 195 | Value | ||
|---|---|---|---|---|---|---|---|
|
Above World Average |
|||||||
| 1 | Police Officers | # People | 138,224 | 2 | 1129 | ||
| 2 | Total Military Force | # People | 362,682 | 4 | 1130 | ||
| 3 | Military Budget (in Billion $) | $ Billion | 17 | 4 | 1130 | ||
| 4 | Military Force/Total World Military Force %. | % People | 0 | 4 | 1130 | ||
| 5 | Military Budget/Total World Military Budget %. | Percent | 0 | 4 | 1129 | ||
|
Below World Average |
|||||||
| 1 | Military Force/Total Pop. % | % People | 1 | 108 | 1234 | ||
| 2 | Lawyers Per 100K | People Per 100K | 137 | 21 | 1234 | ||
| Sr. | Title | Metric | World Average | Rank out of 195 | Value | ||
|---|---|---|---|---|---|---|---|
|
Above World Average |
|||||||
| 1 | # Mobile phone numbers | Count | 40,393,496 | 2 | 1125 | ||
|
Below World Average |
|||||||
| 1 | # Phone Numbers /Total Pop. % | Percent | 101 | 134 | 1235 | ||
| Sr. | Title | Metric | World Average | Rank out of 195 | Value | ||
|---|---|---|---|---|---|---|---|
|
Above World Average |
|||||||
| 1 | Import Ban(Number of products) | Count | 12 | 3 | 1125 | ||
| 2 | GDP (Billions USD) | $ Billions | 600 | 4 | 1127 | ||
| 3 | GDP as a % of Total GDP | Percent | 0 | 6 | 1130 | ||
| 4 | Imports/Total Imports of the World %. | 0 | 7 | 1129 | |||
| 5 | Import of Goods and Services (in Million $) | Amount | 173,515 | 8 | 1128 | ||
| 6 | Export of Goods and Services (in Million $) | Amount | 180,704 | 9 | 1126 | ||
| 7 | Exports /Total Exports of the World %. | 0 | 11 | 1128 | |||
| 8 | FDI (millions USD) | Amount | 3,288 | 13 | 1126 | ||
| 9 | FDI / Total FDI of the World %. | 0 | 14 | 1126 | |||
| 10 | Corporate Tax Rates in % | Rate | 23 | 16 | 1127 | ||
|
Below World Average |
|||||||
| 1 | GDP Per Capita (USD) | $ | 18,044 | 139 | 1235 | ||
| 2 | Imports /Total GDP of the Country %. | 51 | 136 | 1233 | |||
| 3 | Exports/Total GDP of the Country %. | 48 | 133 | 1235 | |||
| 4 | GDP Per Capita at PPP (USD) | $ | 30,199 | 121 | 1232 | ||
| 5 | No. of Companies Listed in NYSE | Count | 65 | 17 | 1233 | ||
Mother Tongue : Hindi
Literacy Rate (%) : 74.40
| Country Capital | : | New Delhi |
|---|---|---|
| GDP Per Capita | : | 2,878 |
| GDP Per Capita Rank | : | 147th/195 |
| Life Expectancy | : | 72 |
| Unemployment Rate | : | 4 |
| Number of Internet Users | : | 972,948,592 |
| Internet Users Rank | : | 2nd/195 |
| Area | : | 2,973,188 |
| Area Rank | : | 7th/195 |
| Total Population | : | 1,476,625,576 |
| Total Population Rank | : | 1st/195 |
| Sr. | City | Total City Population (2023) |
|---|---|---|
| 1 | Abohar | 159,887 |
| 2 | Achalpur | 123,574 |
| 3 | Adilabad | 128,966 |
| 4 | Adityapur | 191,908 |
| 5 | Adoni | 203,132 |
| 6 | Agartala | 440,157 |
| 7 | Agra | 1,744,891 |
| 8 | Ahmadabad | 6,199,495 |
| 9 | Ahmadnagar | 386,127 |
| 10 | Aizawl | 322,855 |
| 11 | Ajmer | 596,742 |
| 12 | Akbarpur | 122,584 |
| 13 | Akola | 468,547 |
| 14 | Alandur | 180,904 |
| 15 | Alappuzha | 191,649 |
| 16 | Aligarh | 962,182 |
| 17 | Allahabad | 1,285,697 |
| 18 | Alwar | 354,986 |
| 19 | Ambala | 214,686 |
| 20 | Ambala Sadar | 115,541 |
| 21 | Ambarnath | 278,949 |
| 22 | Ambattur | 513,002 |
| 23 | Ambikapur | 133,147 |
| 24 | Ambur | 126,105 |
| 25 | Amravati | 712,063 |
| 26 | Amreli | 129,846 |
| 27 | Amritsar | 1,275,574 |
| 28 | Amroha | 218,428 |
| 29 | Anand | 230,422 |
| 30 | Anantapur | 294,025 |
| 31 | Anantnag | 165,719 |
| 32 | Arrah | 287,642 |
| 33 | Asansol | 620,511 |
| 34 | Ashoknagar Kalyangarh | 133,808 |
| 35 | Aurangabad, Bihar | 112,460 |
| 36 | Aurangabad, Maharashtra | 1,293,070 |
| 37 | Avadi | 380,735 |
| 38 | Azamgarh | 122,143 |
| 39 | Badlapur | 191,688 |
| 40 | Bagaha | 123,904 |
| 41 | Bagalkot | 123,134 |
| 42 | Bahadurgarh | 187,947 |
| 43 | Baharampur | 214,796 |
| 44 | Bahraich | 204,893 |
| 45 | Baidyabati | 133,257 |
| 46 | Baleshwar | 158,786 |
| 47 | Ballia | 114,881 |
| 48 | Bally | 124,344 |
| 49 | Balurghat | 168,690 |
| 50 | Banda | 176,613 |
| 51 | Bankura | 151,194 |
| 52 | Bansberia | 114,331 |
| 53 | Banswara | 111,140 |
| 54 | Baran | 129,846 |
| 55 | Baranagar | 269,816 |
| 56 | Barasat | 306,349 |
| 57 | Baraut | 114,221 |
| 58 | Barddhaman | 345,853 |
| 59 | Bareilly | 995,634 |
| 60 | Baripada | 128,526 |
| 61 | Barnala | 128,086 |
| 62 | Barrackpur | 168,140 |
| 63 | Barshi | 130,616 |
| 64 | Basirhat | 137,879 |
| 65 | Basti | 126,215 |
| 66 | Batala | 174,522 |
| 67 | Bathinda | 314,492 |
| 68 | Beawar | 166,379 |
| 69 | Begusarai | 277,299 |
| 70 | Belgaum | 539,192 |
| 71 | Bellary | 451,601 |
| 72 | Bettiah | 145,472 |
| 73 | Betul | 113,670 |
| 74 | Bhadrak | 133,477 |
| 75 | Bhadravati | 166,159 |
| 76 | Bhadreswar | 111,690 |
| 77 | Bhagalpur | 440,267 |
| 78 | Bhalswa Jahangir Pur | 216,887 |
| 79 | Bharatpur | 278,179 |
| 80 | Bharuch | 185,966 |
| 81 | Bhatpara | 424,772 |
| 82 | Bhavnagar | 666,727 |
| 83 | Bhilai Nagar | 690,716 |
| 84 | Bhilwara | 395,591 |
| 85 | Bhilmavaram | 161,758 |
| 86 | Bhind | 217,437 |
| 87 | Bhiwadi | 115,431 |
| 88 | Bhiwandi | 780,948 |
| 89 | Bhiwani | 215,787 |
| 90 | Bhopal | 1,978,724 |
| 91 | Bhubaneswar | 974,287 |
| 92 | Bhuj | 163,738 |
| 93 | Bhusawal | 206,213 |
| 94 | Bid | 161,427 |
| 95 | Bidar | 237,685 |
| 96 | Bidhan Nagar | 237,134 |
| 97 | Biharsharif | 327,146 |
| 98 | Bijapur | 360,268 |
| 99 | Bikaner | 709,092 |
| 100 | Bilaspur | 402,303 |
| 101 | Bokaro Steel City | 456,442 |
| 102 | Bongaon | 119,833 |
| 103 | Botad | 143,381 |
| 104 | Brahmapur | 392,400 |
| 105 | Bangalore | 9,348,375 |
| 106 | Budaun | 175,292 |
| 107 | Bulandshahar | 253,090 |
| 108 | Bundi | 115,431 |
| 109 | Burari | 160,877 |
| 110 | Burhanpur | 232,073 |
| 111 | Buxar | 113,230 |
| 112 | Champdani | 122,474 |
| 113 | Chandannagar | 183,655 |
| 114 | Chandausi | 125,885 |
| 115 | Chandigarh | 1,068,040 |
| 116 | Chandrapur | 352,565 |
| 117 | Chapra | 222,719 |
| 118 | Chas | 155,815 |
| 119 | Chennai | 5,113,189 |
| 120 | Chhatarpur | 156,366 |
| 121 | Chhindwara | 192,679 |
| 122 | Chilakaluripet | 111,580 |
| 123 | Chitradurga | 160,547 |
| 124 | Chittaurgarh | 128,086 |
| 125 | Chittoor | 176,833 |
| 126 | Churu | 132,267 |
| 127 | Coimbatore | 1,156,181 |
| 128 | Cuddalore | 191,028 |
| 129 | Cuttack | 671,459 |
| 130 | Dabgram | 130,947 |
| 131 | Dallo Pura | 170,341 |
| 132 | Damoh | 153,615 |
| 133 | Darbhanga | 325,716 |
| 134 | Darjiling | 130,726 |
| 135 | Datia | 110,369 |
| 136 | Davanagere | 478,670 |
| 137 | Deesa | 122,364 |
| 138 | Dehradun | 632,505 |
| 139 | Dehri | 150,974 |
| 140 | Delhi Cantonment | 121,483 |
| 141 | Delhi Municipal Corporation | 12,142,379 |
| 142 | Deoghar | 223,489 |
| 143 | Deoli | 186,076 |
| 144 | Deoria | 142,391 |
| 145 | Dewas | 318,673 |
| 146 | Dhamtari | 111,910 |
| 147 | Dhanbad | 1,279,205 |
| 148 | Dharmavaram | 134,138 |
| 149 | Dhaulpur | 146,462 |
| 150 | Dhule | 413,307 |
| 151 | Dibrugarh | 160,107 |
| 152 | Dimapur | 135,128 |
| 153 | Dinapur Nizamat | 200,711 |
| 154 | Dindigul | 228,111 |
| 155 | Dohad | 130,726 |
| 156 | Dum Dum | 126,325 |
| 157 | Durg | 295,785 |
| 158 | Durgapur | 623,372 |
| 159 | Eluru | 239,885 |
| 160 | English Bazar | 226,130 |
| 161 | Erode | 172,871 |
| 162 | Etah | 130,396 |
| 163 | Etawah | 282,581 |
| 164 | Faizabad | 181,785 |
| 165 | Faridabad | 1,556,063 |
| 166 | Farrukhabad-cum-Fatehgarh | 304,368 |
| 167 | Fatehpur | 212,596 |
| 168 | Firozabad | 664,856 |
| 169 | Firozpur | 121,373 |
| 170 | Gadag-Betigeri | 189,928 |
| 171 | Gandhidham | 272,897 |
| 172 | Gandhinagar | 322,195 |
| 173 | Ganganagar | 261,673 |
| 174 | Gangapur City | 131,057 |
| 175 | Gangawati | 126,105 |
| 176 | Gangtok | 110,369 |
| 177 | Gaya | 521,696 |
| 178 | Ghaziabad | 1,814,105 |
| 179 | Ghazipur | 133,147 |
| 180 | Giridih | 125,995 |
| 181 | Godhra | 158,016 |
| 182 | Gokal Pur | 134,138 |
| 183 | Gonda | 125,445 |
| 184 | Gondal | 123,464 |
| 185 | Gondiya | 146,132 |
| 186 | Gorakhpur | 741,004 |
| 187 | Greater Mumbai | 13,691,510 |
| 188 | Greater Noida | 112,350 |
| 189 | Gudivada | 130,066 |
| 190 | Gulbarga | 597,623 |
| 191 | Guna | 199,061 |
| 192 | Guntakal | 138,979 |
| 193 | Guntur | 737,372 |
| 194 | Gurgaon | 975,497 |
| 195 | Guwahati | 1,058,907 |
| 196 | Gwalior | 1,160,253 |
| 197 | Habra | 161,978 |
| 198 | Hajipur | 162,528 |
| 199 | Haldia | 220,959 |
| 200 | Haldwani-cum-Kathgodam | 221,729 |
| 201 | Halisahar | 137,439 |
| 202 | Hanumangarh | 166,159 |
| 203 | Haora | 1,185,232 |
| 204 | Hapur | 289,403 |
| 205 | Hardoi | 216,777 |
| 206 | Hardwar | 254,521 |
| 207 | Hassan | 170,561 |
| 208 | Hastsal | 194,659 |
| 209 | Hathras | 157,356 |
| 210 | Hazaribag | 156,806 |
| 211 | Hindaun | 116,091 |
| 212 | Hindupur | 166,929 |
| 213 | Hinganghat | 112,020 |
| 214 | Hisar | 337,820 |
| 215 | Hoshangabad | 129,846 |
| 216 | Hoshiarpur | 185,636 |
| 217 | Hospet | 226,901 |
| 218 | Hosur | 128,526 |
| 219 | Hubli-Dharwad | 1,038,549 |
| 220 | Hugli-Chinsurah | 197,960 |
| 221 | Hyderabad | 7,695,367 |
| 222 | Ichalkaranji | 316,252 |
| 223 | Imphal | 305,028 |
| 224 | Indore | 2,194,621 |
| 225 | Jabalpur | 1,190,293 |
| 226 | Jagadhri | 137,439 |
| 227 | Jagdalpur | 138,099 |
| 228 | Jagtial | 114,331 |
| 229 | Jaipur | 3,352,012 |
| 230 | Jalandhar | 956,130 |
| 231 | Jalgaon | 506,400 |
| 232 | Jalna | 314,272 |
| 233 | Jalpaiguri | 118,072 |
| 234 | Jamalpur | 115,981 |
| 235 | Jammu | 634,046 |
| 236 | Jamnagar | 661,225 |
| 237 | Jamshedpur | 745,405 |
| 238 | Jamuria | 164,178 |
| 239 | Jaunpur | 198,511 |
| 240 | Jehanabad | 113,560 |
| 241 | Jetpur Navagadh | 130,176 |
| 242 | Jhansi | 556,468 |
| 243 | Jhunjhunun | 130,396 |
| 244 | Jind | 184,426 |
| 245 | Jodhpur | 1,162,233 |
| 246 | Jorhat | 139,420 |
| 247 | Junagadh | 351,575 |
| 248 | Kadapa | 379,525 |
| 249 | Kaithal | 159,447 |
| 250 | Kakinada | 422,770 |
| 251 | Kalol | 147,893 |
| 252 | Kalyan Dombivali | 1,372,518 |
| 253 | Kalyani | 110,699 |
| 254 | Kamarhati | 363,349 |
| 255 | Kancheepuram | 180,904 |
| 256 | Kanchrapara | 142,611 |
| 257 | Kannur | 255,826 |
| 258 | Kanpur | 3,045,993 |
| 259 | Kanpur Cantonment | 119,392 |
| 260 | Karaikkudi | 117,412 |
| 261 | Karawal Nagar | 246,818 |
| 262 | Karimnagar | 318,893 |
| 263 | Karnal | 332,428 |
| 264 | Kasganj | 111,470 |
| 265 | Kashipur | 133,808 |
| 266 | Katihar | 264,974 |
| 267 | Khammam | 216,007 |
| 268 | Khandwa | 220,849 |
| 269 | Khanna | 140,960 |
| 270 | Kharagpur | 228,441 |
| 271 | Khardaha | 119,392 |
| 272 | Khargone | 127,865 |
| 273 | Khora | 209,074 |
| 274 | Khurja | 133,367 |
| 275 | Kirari Suleman Nagar | 311,631 |
| 276 | Kishanganj | 116,421 |
| 277 | Kishangarh | 170,451 |
| 278 | Kochi | 697,208 |
| 279 | Kolar | 152,404 |
| 280 | Kolhapur | 604,335 |
| 281 | Kolkata | 4,948,130 |
| 282 | Kollam | 403,954 |
| 283 | Korba | 401,973 |
| 284 | Kota | 1,102,262 |
| 285 | Kottayam | 150,547 |
| 286 | Kozhikode | 670,385 |
| 287 | Krishnanagar | 168,470 |
| 288 | Kulti | 345,303 |
| 289 | Kumbakonam | 154,275 |
| 290 | Kurichi | 136,118 |
| 291 | Kurnool | 503,539 |
| 292 | Lakhimpur | 167,259 |
| 293 | Lalitpur | 146,682 |
| 294 | Latur | 421,340 |
| 295 | Loni | 567,912 |
| 296 | Lucknow | 3,099,913 |
| 297 | Ludhiana | 1,781,424 |
| 298 | Machilipatnam | 186,956 |
| 299 | Madanapalle | 198,291 |
| 300 | Madhavaram | 131,057 |
| 301 | Madhyamgram | 215,787 |
| 302 | Madurai | 1,120,088 |
| 303 | Mahbubnagar | 209,515 |
| 304 | Mahesana | 209,955 |
| 305 | Maheshtala | 493,305 |
| 306 | Mainpuri | 150,313 |
| 307 | Malappuram | 111,580 |
| 308 | Malegaon | 529,508 |
| 309 | Malerkotia | 148,993 |
| 310 | Mandoli | 132,487 |
| 311 | Mandsaur | 155,925 |
| 312 | Mandya | 151,194 |
| 313 | Mangalagiri | 117,962 |
| 314 | Mangalore | 549,646 |
| 315 | Mango | 246,268 |
| 316 | Mathura | 385,027 |
| 317 | Maunath Bhanjan | 306,679 |
| 318 | Medinipur | 186,296 |
| 319 | Meerut | 1,436,451 |
| 320 | Mira Bhayandar | 890,657 |
| 321 | Miryalaguda | 115,431 |
| 322 | Mirazpur-cum-Vindhyachal | 258,482 |
| 323 | Modinagar | 143,381 |
| 324 | Moga | 179,804 |
| 325 | Moradabad | 977,038 |
| 326 | Morena | 220,628 |
| 327 | Morvi | 231,632 |
| 328 | Motihari | 138,869 |
| 329 | Mughalsarai | 120,713 |
| 330 | Muktsar | 128,416 |
| 331 | Munger | 234,713 |
| 332 | Murwara (Katni) | 244,177 |
| 333 | Mustafabad | 139,970 |
| 334 | Muzaffarnagar | 432,234 |
| 335 | Muzaffarpur | 390,089 |
| 336 | Mysore | 1,013,020 |
| 337 | Nabadwip | 138,099 |
| 338 | Nadiad | 247,698 |
| 339 | Nagaon | 133,808 |
| 340 | Nagapattinam | 113,230 |
| 341 | Nagaur | 115,761 |
| 342 | Nagda | 110,039 |
| 343 | Nagercoli | 247,368 |
| 344 | Nagpur | 2,647,212 |
| 345 | Naihati | 239,775 |
| 346 | Nalgonda | 169,790 |
| 347 | Nanded | 605,655 |
| 348 | Nandurbar | 122,143 |
| 349 | Nandyal | 232,623 |
| 350 | Nangloi Jat | 226,240 |
| 351 | Narasaraopet | 129,296 |
| 352 | Nashik | 1,635,292 |
| 353 | Navi Mumbai | 1,232,989 |
| 354 | Navsari | 188,277 |
| 355 | Neemuch | 141,510 |
| 356 | Nellore | 602,574 |
| 357 | New Delhi Municipal Council | 283,681 |
| 358 | Neyveli | 116,311 |
| 359 | Nizamabad | 342,442 |
| 360 | Noida | 701,279 |
| 361 | North Barrackpur | 146,132 |
| 362 | North Dum Dum | 274,107 |
| 363 | Ongole | 229,212 |
| 364 | Orai | 209,735 |
| 365 | Osmanabad | 123,024 |
| 366 | Ozhukarai | 330,227 |
| 367 | Palakkad | 144,151 |
| 368 | Palanpur | 155,815 |
| 369 | Pali | 253,200 |
| 370 | Pallavaram | 257,492 |
| 371 | Palwal | 145,142 |
| 372 | Panchkula | 232,623 |
| 373 | Panihati | 415,178 |
| 374 | Panipat | 325,716 |
| 375 | Panvel | 198,070 |
| 376 | Parbhani | 338,040 |
| 377 | Patan | 147,122 |
| 378 | Pathankot | 171,991 |
| 379 | Patiala | 490,995 |
| 380 | Patna | 1,853,389 |
| 381 | Pilibhit | 140,850 |
| 382 | Pimpri Chinchwad | 1,901,146 |
| 383 | Pithampur | 138,869 |
| 384 | Porbandar | 168,140 |
| 385 | Port Blair | 118,952 |
| 386 | Proddatur | 180,464 |
| 387 | Puducherry | 268,936 |
| 388 | Pudukkottai | 129,406 |
| 389 | Pune | 3,438,173 |
| 390 | Puri | 220,739 |
| 391 | Purnia | 310,530 |
| 392 | Puruliya | 133,257 |
| 393 | Rae Bareli | 210,505 |
| 394 | Raichur | 257,602 |
| 395 | Raiganj | 202,032 |
| 396 | Raigarh | 165,059 |
| 397 | Raipur | 1,130,432 |
| 398 | Rajahmundry | 414,077 |
| 399 | Rajapalayam | 143,491 |
| 400 | Rajarhat Gopalpur | 443,238 |
| 401 | Rajkot | 1,456,258 |
| 402 | Rajnandgaon | 179,474 |
| 403 | Rajpur Sonarpur | 467,006 |
| 404 | Ramagundam | 267,395 |
| 405 | Rampur | 357,957 |
| 406 | Ranchi | 1,181,160 |
| 407 | Ranibennur | 117,082 |
| 408 | Raniganj | 142,391 |
| 409 | Ratlam | 291,494 |
| 410 | Raurkela Industrial Township | 238,125 |
| 411 | Raurkela Town | 352,125 |
| 412 | Rewa | 259,362 |
| 413 | Rewari | 157,356 |
| 414 | Rishra | 137,109 |
| 415 | Robertson Pet | 178,483 |
| 416 | Rohtak | 409,676 |
| 417 | Roorkee | 130,066 |
| 418 | Rudrapur | 170,121 |
| 419 | S.A.S. Nagar | 183,655 |
| 420 | Sagar | 302,167 |
| 421 | Saharanpur | 776,326 |
| 422 | Saharsa | 172,211 |
| 423 | Salem | 912,555 |
| 424 | Sambalpur | 208,414 |
| 425 | Sambhal | 242,966 |
| 426 | Sangli-Miraj Kupwad | 553,277 |
| 427 | Santipur | 167,039 |
| 428 | Sasaram | 162,198 |
| 429 | Satara | 132,267 |
| 430 | Satna | 311,411 |
| 431 | Sawai Madhpour | 133,257 |
| 432 | Secunderabad | 239,775 |
| 433 | Sehore | 120,064 |
| 434 | Seoni | 112,570 |
| 435 | Serampore | 200,051 |
| 436 | Shahjahanpur | 362,799 |
| 437 | Shamli | 118,072 |
| 438 | Shikohabad | 118,182 |
| 439 | Shillong | 157,576 |
| 440 | Shimla | 186,626 |
| 441 | Shimoga | 355,096 |
| 442 | Shivpuri | 198,070 |
| 443 | Sikar | 269,046 |
| 444 | Silchar | 196,860 |
| 445 | Siliguri | 564,831 |
| 446 | Singrauli | 242,416 |
| 447 | Sirsa | 200,821 |
| 448 | Sitapur | 194,989 |
| 449 | Siwan | 148,663 |
| 450 | Solapur | 1,047,132 |
| 451 | Sonipat | 318,343 |
| 452 | South Dum Dum | 443,788 |
| 453 | Srikakulam | 151,744 |
| 454 | Srinagar | 1,327,512 |
| 455 | Sujangarh | 111,690 |
| 456 | Sultan Pur Majra | 199,831 |
| 457 | Sultanpur | 118,402 |
| 458 | Surat | 4,953,522 |
| 459 | Surendranagar Dudhrej | 195,760 |
| 460 | Suryapet | 117,522 |
| 461 | Tadepelligudem | 114,441 |
| 462 | Tadpatri | 119,062 |
| 463 | Tambaram | 192,348 |
| 464 | Tenali | 181,455 |
| 465 | Thane | 2,026,371 |
| 466 | Thanesar | 170,781 |
| 467 | Thanjavur | 245,277 |
| 468 | Thiruvananthapuram | 867,439 |
| 469 | Thoothkkudi | 261,673 |
| 470 | Thrissur | 347,724 |
| 471 | Tinsukia | 127,976 |
| 472 | Tiruchirappalli | 932,472 |
| 473 | Tirunelveli | 521,145 |
| 474 | Tirupati | 324,946 |
| 475 | Tiruppur | 489,014 |
| 476 | Tiruvannamalai | 159,887 |
| 477 | Tiruvottiyur | 274,438 |
| 478 | Titagarh | 128,196 |
| 479 | Tonk | 181,895 |
| 480 | Tumkur | 332,428 |
| 481 | Udaipur | 496,387 |
| 482 | Udgir | 114,001 |
| 483 | Udupi | 159,557 |
| 484 | Ujjain | 566,922 |
| 485 | Ulhasnagar | 556,908 |
| 486 | Uluberia | 258,922 |
| 487 | Unnao | 195,540 |
| 488 | Uttarpara Kotrung | 175,072 |
| 489 | Vadodara | 1,928,326 |
| 490 | Valsad | 153,835 |
| 491 | Vapi | 180,024 |
| 492 | Varanasi | 1,318,819 |
| 493 | Vasai-Virar City | 1,345,118 |
| 494 | Vellore | 204,453 |
| 495 | Veraval | 188,277 |
| 496 | Vidisha | 171,661 |
| 497 | Vijayawada | 1,257,967 |
| 498 | Visakhnapatnam | 1,901,586 |
| 499 | Vizianagaram | 251,660 |
| 500 | Warangal | 775,336 |
| 501 | Wardha | 117,082 |
| 502 | Yamunanagar | 238,895 |
| 503 | Yavatmal | 128,306 |
Q - Does Prarang do surveys to collect data? How does Prarang have such granular
Country-level details which no private or public data source offers?
A - Prarang does not conduct surveys to gather data; instead, we rely on publicly available
sources such as UN Population data, the CIA World Factbook, and private surveys whose results
are accessible through news media and public websites. Our data classification follows a
three-fold method rooted in Indian logic (Tarkashastra): Pramana (evidence-based data
collection) involves gathering data from credible sources; Anumana (estimation and inference)
uses modeling to draw inferences from the collected data; and Upamana (comparison) ranks
countries through relative comparison, calculating the Samana (country average) to determine
whether each country ranks above or below this benchmark. All data sources and estimation
modeling methods are transparently detailed and accessible, with information available for each
data field by clicking the "i" icon.
A - Prarang does not do any surveys. It does data modeling & estimations based on third-party census & surveys, already in the public domain. It also shares the source of the data it uses. Users need to make their own judgment of how and for what purpose and when they use the data that they download from this Prarang website.