Analytics: World
Analytics: World
Date: June 23, 2026
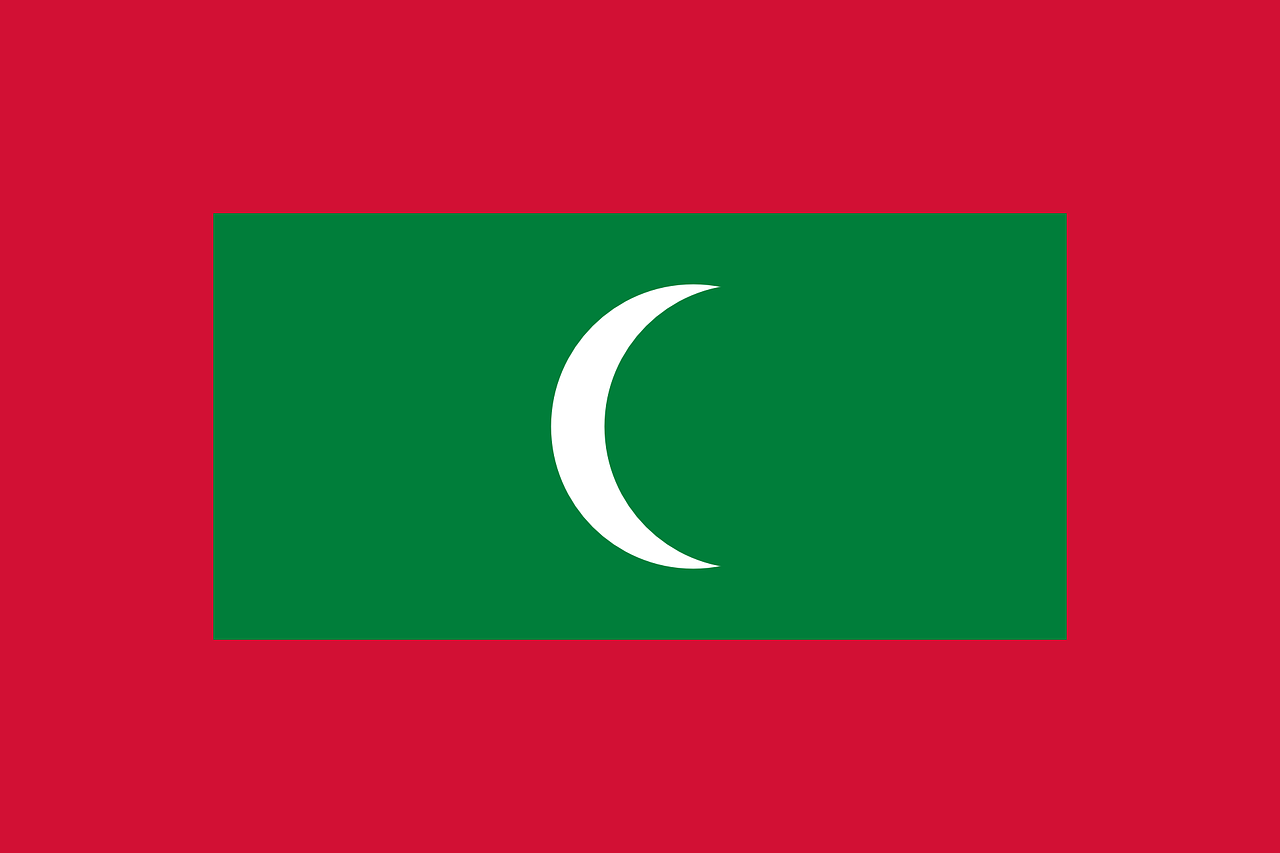 Maldives is a mid-size country with 0.01% of the world's population. Maldives is a republic country.
Maldives is the 167th ranked country in population and 187th ranked in area out of 195 countries in the world. Please keep the country rank in perspective, for the highlights below.

 GDP Per Capita (USD)
 Literacy Rate (%)
The Average GDP Per Capita (USD) of 195 countries in the world is 18,044. Maldives is the 60th highest ranked country out of 195 countries. This implies that this country is a developed country.
The Average Literacy Rate (%) of 195 countries in the world is 86. Maldives is the 75th highest ranked country out of 195 countries. This indicates that there is a better educational infrastructure in this country as compared to other countries.
 Enrolment in secondary edu.
 Urban Population (2021)
 Total Population
 Internet Users
Out of 195 countries in the world, Maldives is the 24th worst ranked in Enrolment in secondary edu. . This may take into context a lower country population, or imply that lesser people in this country pursue secondary education when compared to other countries.
Out of 195 countries in the world, Maldives is the 27th worst ranked in Urban Population (2021) . This may indicate that there is poor economic development or may imply that the formal economy of the country is less compared to other countries.
The Average Total Population of 195 countries in the world is 42,357,833. Maldives is the 29th worst ranked country out of 195 countries. Taking into context the total population of the world, this country is less populated in comparison to other countries.
Maldives is the 31st worst ranked in Internet Users out of all the 195 countries.This may take into context a lower country population, and implies that there are lesser people with access to the internet when compared to other countries.
Mother Tongue : Dhivehi
Literacy Rate (%) : 97.70
| Country Capital | : | Male |
|---|---|---|
| GDP Per Capita | : | 18,207 |
| GDP Per Capita Rank | : | 60th/195 |
| Life Expectancy | : | 81 |
| Unemployment Rate | : | 0 |
| Number of Internet Users | : | 445,996 |
| Internet Users Rank | : | 165th/195 |
| Area | : | 300 |
| Area Rank | : | 187th/195 |
| Total Population | : | 531,517 |
| Total Population Rank | : | 167th/195 |