 Analytics: World
Analytics: World
Date: June 23, 2026
 Palestine is a mid-size country with 0.1% of the world's population. It has 5 world heritage sites.
Palestine is the 117th ranked country in population and 162nd ranked in area out of 195 countries in the world. Please keep the country rank in perspective, for the highlights below.
 Literacy Rate (%)
Out of 195 countries in the world, Palestine is the 82nd highest ranked in Literacy Rate (%) . This indicates that there is a better educational infrastructure in this country as compared to other countries.
 Total Population
 Potatoes prod.
 Internet Users
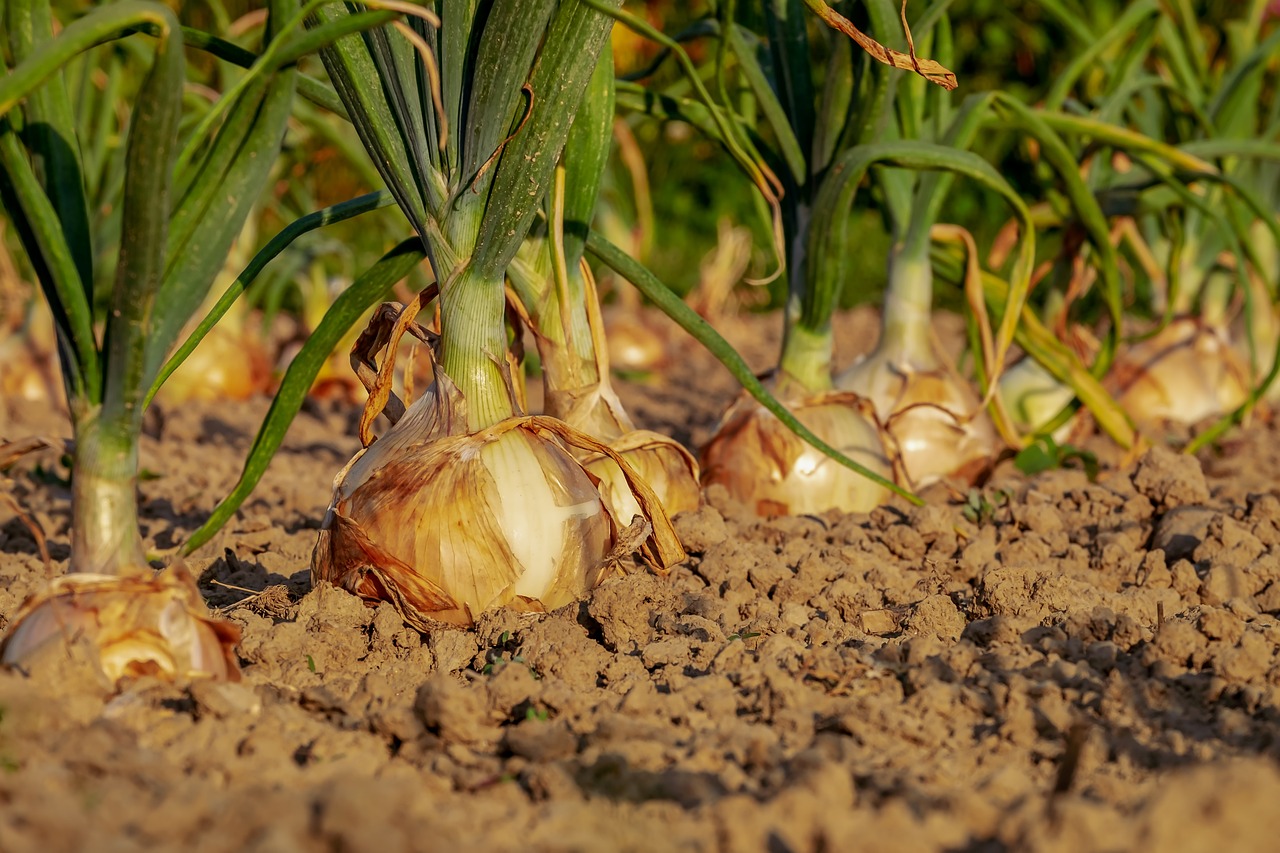 Onion prod.
Out of 195 countries in the world, Palestine is the 79th worst ranked in Total Population . Taking into context the total population of the world, this country is less populated in comparison to other countries.
Out of 195 countries in the world, Palestine is the 86th worst ranked in Potatoes prod. . This is indicative of less focus on the production of potatoes, or scarcity of fertile land, or higher industrialisation as compared to other countries.
The Average Internet Users of 195 countries in the world is 28,543,790. Palestine is the 91st worst ranked country out of 195 countries. This may take into context a lower country population, and implies that there are lesser people with access to the internet when compared to other countries.
Out of 195 countries in the world, Palestine is the 100th worst ranked in Onion prod. . This is indicative of less focus on the production of onion, or scarcity of fertile land, or higher industrialisation as compared to other countries.
Mother Tongue : Arabic
Literacy Rate (%) : 97.00
| Country Capital | : | Ramallah (resp. East Jerusalem) |
|---|---|---|
| GDP Per Capita | : | 0 |
| GDP Per Capita Rank | : | 146th/195 |
| Life Expectancy | : | 69 |
| Unemployment Rate | : | 0 |
| Number of Internet Users | : | 4,932,233 |
| Internet Users Rank | : | 105th/195 |
| Area | : | 6,020 |
| Area Rank | : | 162nd/195 |
| Total Population | : | 5,692,790 |
| Total Population Rank | : | 117th/195 |
